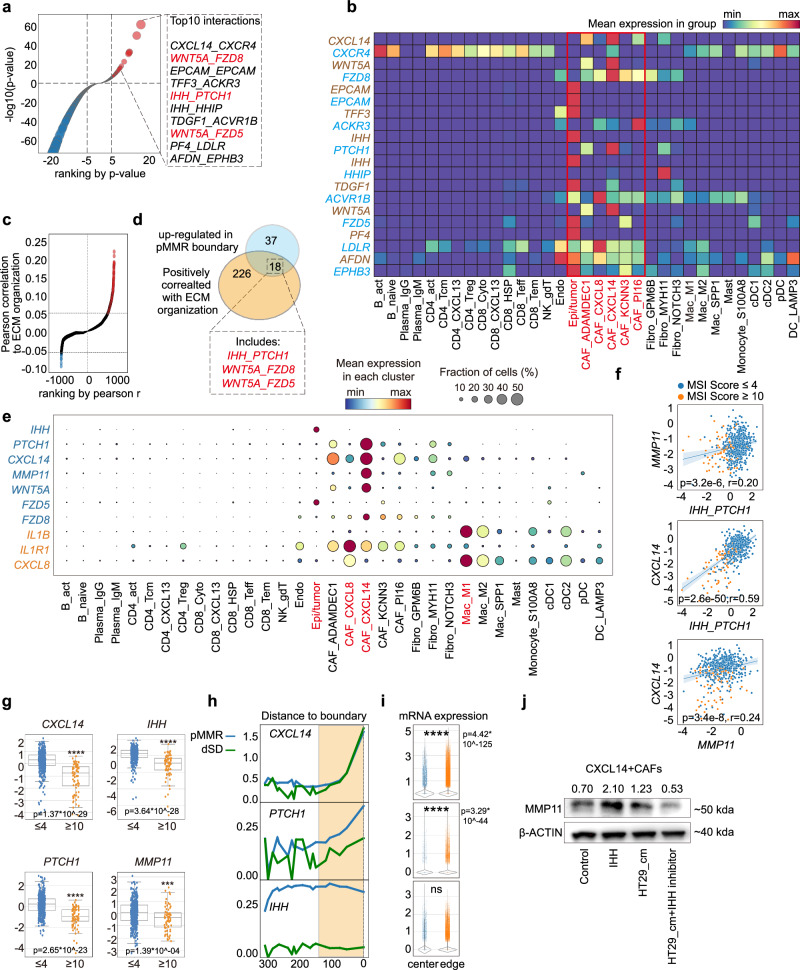
Fig. 6. Tumor cells promote CXCL14+CAFs via IHH/PTCH1 axis to constrain ICB efficacy in pMMR CRC patients.
a Ligand-receptor pair enrichment analysis (ranked by p value) in tumor-stroma boundary of Stereo-seq dataset. The top 10 enriched ligand-receptor pairs in pMMR (-log10 p value ≥ 5) are highlighted. Comparison is made by two-tailed t test. b The heatmap represents the expressions of the top 10 enriched ligand-receptor pairs in single cell clusters from scRNA-seq dataset. Ligands are labeled with brown, while receptors are labeled with light blue. Epithelia cells and CAFs are highlighted in red. c Pearson correlation of ligand-receptor pairs towards ECM organization scores in tumor-stroma boundary of pMMR patients. The positive correlations (r > 0.05) are labeled in red, and the negative correlations (r < 0.05) are labeled in blue. d Venn diagram of ligand-receptor pairs upregulated in the tumor-stroma boundary of treatment naïve pMMR patients and positively correlated with ECM organization identified 18 overlapped ligand-receptor pairs. e Bubble plots of expression profiling of identified ligand-receptor pairs and IL1B, IL1R1, CXCL8 in single cell clusters from scRNA-seq dataset are shown. The plot are sized by the fraction of cells with positive gene expression, while the color represents the gene expression level. f Pearson correlations and (g) expressions of IHH_PTCH1, MMP11 and CXCL14 from COAD TCGA dataset are shown. Patients are stratified to MSI-hi (MSI sensor score≥10, patient number = 78) and MSI-lo (MSI sensor score≤4, patient number = 494) accordingly. IHH_PTCH1 scores are calculated as sum of IHH and PTCH1 Z-scores. Data are represented as mean±IQR and analyzed by unpaired 2-tailed Student t test. Ns, not significant; *, p < 0.05; **, p < 0.01; ***, p < 0.001; ***, p < 0.0001. The line and the band present the linear regression model and confidence interval (95%) respectively. h Loess smoothed curve and (i) violin plots represent the distribution and expressions of PTCH1, CXCL14, and MMP11 from tumor center ( + 300 μm) to the tumor-stroma boundary (0 μm) in dSD and pMMR patients. Data are represented as mean ± IQR and analyzed by unpaired 2-tailed Student t test with Bonferroni correction. Ns, not significant; *, p < 0.05; **, p < 0.01; ***, p < 0.001; ***, p < 0.0001. N number of the spots: center=9313; edge=56,357. j Western blot analysis of MMP11 in indicated group is shown. β-actin serves as loading control. Number indicates the relative expression towards β-actin. This result represents 3 independent experimental repetitions.

