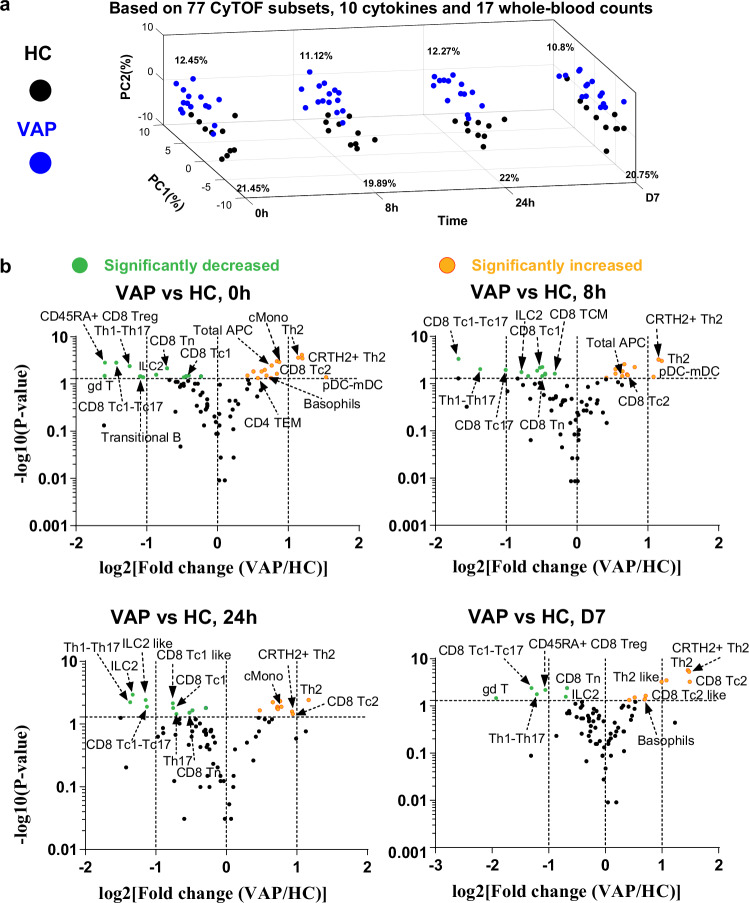
Fig. 2. First-week immune responses in VAP following AIT launch.
a Time–slice PCA plot of the samples from VAP and HC throughout various time points. The analysis was performed by integrating CyTOF, whole-blood-count and cytokines data. b Volcano plot showing the comparison of the percentages of different immune subsets, as quantified by supervised analysis of CyTOF data in VAP vs. HC at the indicated sampling time point. The selected list of significantly enhanced or decreased immune subsets (p < =0.05) are highlighted. Too general subsets (e.g., CD3¯CD19¯) were not labelled even if they showed a significant change. APC, antigen-presenting cells; CD4+ Th1, type 1 helper T cells; CD4+ Th2, type 2 helper T cells; CD8+ Tc1, type 1 cytotoxic cells; CD8+ Tc2, type 2 cytotoxic cells; CD8+ Treg, CD8+ regulatory T cells; cMono, classical monocytes; DC, dendritic cells; gdT (γδ T), gamma-delta T cells; ILC, innate lymphoid cells; mDC, myeloid DC; pDC, plasmacytoid DC; pDC-mDC, hybrid plasmacytoid and myeloid DC; Tc1-Tc17, hybrid type 1 and type 17 cytotoxic CD8+ T cells; Th1-Th17, hybrid type 1 and type 17 CD4 T helper cells; TCM, central memory T cells; TEM, effector memory T cells; Tn, naive T cells. HC, healthy controls, n = 10 independent individuals (a, b); PAP, pollen allergy patients, n = 16 independent individuals (b); VAP, venom allergy patients, n = 18 independent individuals (a, b). P-value was determined by non-paired two-tailed Mann-Whitney test without the adjustments for multiple comparisons. The full lists of immune subsets with marker combinations, fold changes and P values generated from the comparisons between different groups and time points by our supervised CyTOF analysis in volcano plots of this and other figures were also provided as part of Source Data. For more details, one could visit our i3Dare website. Source data are provided as a Source Data file.

