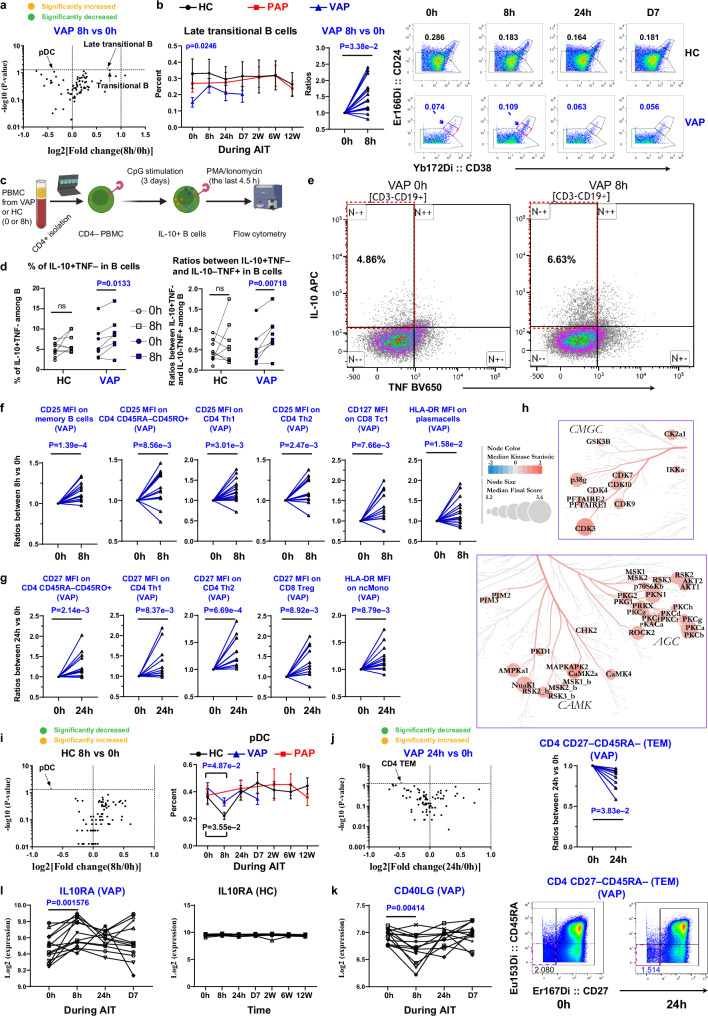
Fig. 4. Pulse of IL-10-producing B cells accompanied with decline of allergen-specific Th2 cells in VAP at 8 h following AIT launch.
a Volcano plot of the immune subsets percentage changes. b Left, Percentages of late transitional B cells (CD19+CD27¯CD24++CD38++) among living singlets. Middle, Normalized to baseline. Right, Representative cytometry plots of CD24 and CD38 expression among CD19+CD27¯ B cells. c Schematic of analyzing IL-10-producing B cells. d Percentages of IL-10+TNF¯ cells or IL-10+TNF¯/ IL-10¯TNF+ cell ratios among living B-cell singlets following stimulation. e Representative cytometry plots of B-cell intracellular cytokine expression. f, g Normalized MSI of ex-vivo expression of indicated markers. h Kinome tree showing a significant change (8 h vs. baseline) in VAP’s PBMC depleted of CD4+ T-cells. The nodes showing a Median Final Score (representing significance) >1.2 are marked with label(s). The Median Kinase Statistic represents the direction of effect. i, j Volcano plots of the immune subset percentage changes (left). Right panel of i, percentages of pDC (CD11c¯CD123+) among living singlets. Upper right in j, Normalized percentages of CD4+ TEM (CD27¯CD45RA¯). Lower right in j, Representative cytometry plots of CD27 and CD45RA expression among CD4+ T cells. Expression of CD40LG (k) or IL10RA (l) transcripts in Th2 cells (n = 14 independent individuals). Data represent mean ± SEM (b, i). P-value was determined by paired two-tailed Mann-Whitney test in a, b, i, j or by paired two-tailed Student t test in d, f, g, k, l. q-values were generated using the two-stage step-up method (Benjamini, Krieger, and Yekutieli). For h, a mixed model statistical analysis was based on a one-tailed permutation test without multiple comparison correction (see Methods). ns, non-significant (p > 0.05). Each line in b, d, f, g, j and k, l links different time points of the same individual. In a, i, j, significantly enhanced or decreased immune subsets (p < =0.05) are marked. MSI, median signal intensity; ncMono, non-classical monocytes; pDC, plasmacytoid DC; CD8+ Treg, CD8+ regulatory T cells; TEM, effector memory T cells. For all the panels, HC, healthy controls, n = 10 independent individuals except for d and h (n = 9); PAP, pollen allergy patients, n = 16 independent individuals (no PAP in d and h); VAP, venom allergy patients, n = 18 independent individuals except for d and h (n = 9). Source data are provided as a Source Data file. Created in BioRender. Demczuk, A. (2024) BioRender.com/n34j539 (panel c).

