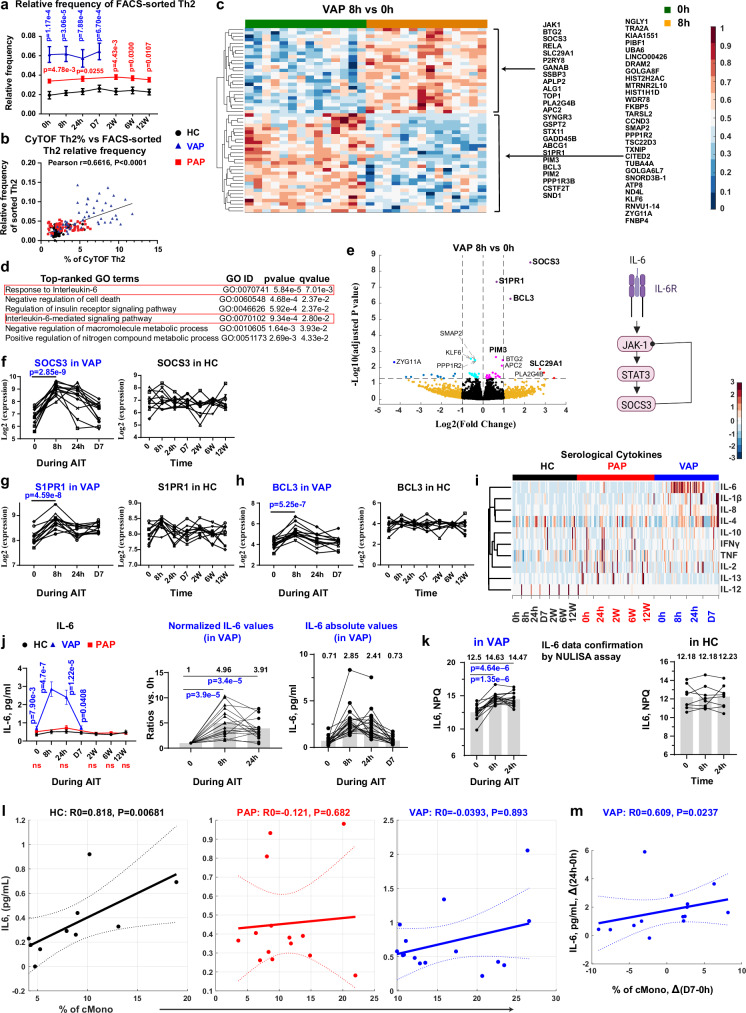
Fig. 5. Th2-cell-type-specific RNA-seq analysis reveals a pulse of IL-6 signaling at 8 h following AIT launch in VAP.
a Relative frequency of FACS-sorted Th2 cells among living CD4+ T cells. q = 2.37e-4 (0 h), q = 1.24e-4 (8 h), q = 7.96e-4 (D1), q = 7.96e-4 (D7) – VAP vs HC; q = 0.0121 (0 h), q = 0.0303 (D1), q = 0.0121 (W2), q = 0.0303 (W6) and q = 0.0181 (W12) – PAP vs HC. b Pearson correlation between the sorted Th2 frequencies and CyTOF-measured Th2 percentages. c Heatmap of differentially-expressed genes (DEGs) between indicated time points in Th2. d Top-ranked GO processes among DEGs in c. e Left, Volcano plot highlighting DEGs in Th2. The substantially and significantly changed genes were labelled. Right, Schematic of IL-6 signaling. mRNA expression of SOCS3 (f), S1PR1 (g) and BCL3 (h) in Th2. P-values were adjusted with FDR. i Heatmap of 10 cytokines. j Serum IL-6 levels. Left, IL-6 levels among groups. q = 5.32e-3 (0 h), q = 9.6e-7 (8 h), q = 1.23e-5 (D1), q = 0.0206 (D7) – VAP vs HC. Normalized IL-6 levels (middle) or Scatter dot plots of absolute IL-6 levels (right). Mean for each time point in middle and right panels is labelled. k Confirmatory analysis of IL-6 levels by the NULISA platform. NPQ, NULISA protein quantification units (log2). Spearman correlation between serological IL-6 levels and cMono percentages among living singlets at baseline (l) or between the changed serological IL-6 levels and the altered percentages of cMono (m). Data represent mean ± SEM (a, j). P-value was determined by paired Bayes-moderated two-tailed t test [c, e, f-h] or non-paired [a, j (left)] two-tailed Mann-Whitney test, by paired two-tailed Student’s t test in b, j (middle), k, by two-tailed paired Wilcoxon signed-rank enrichment test (d), or by two-tailed exact permutation distribution test in l, m. q values were generated using the two-stage step-up method (Benjamini, Krieger, and Yekutieli). NS or unlabeled, not significant (p > 0.05). Each line in f-h and j, k links different samples of one individual. AIT, antigen-specific immunotherapy; APC, antigen-presenting cells; CyTOF, Mass cytometry; FACS, fluorescence-activated cell sorting. For all the panels, HC, healthy controls, n = 10 independent individuals except for panel k (n = 8); PAP, pollen allergy patients, n = 16 independent individuals; VAP, venom allergy patients, n = 18 independent individuals except for panels a-h, k (n = 15). Source data are provided as a Source Data file. Created in BioRender. Demczuk, A. (2024) BioRender.com/t00y783 (panel e).

