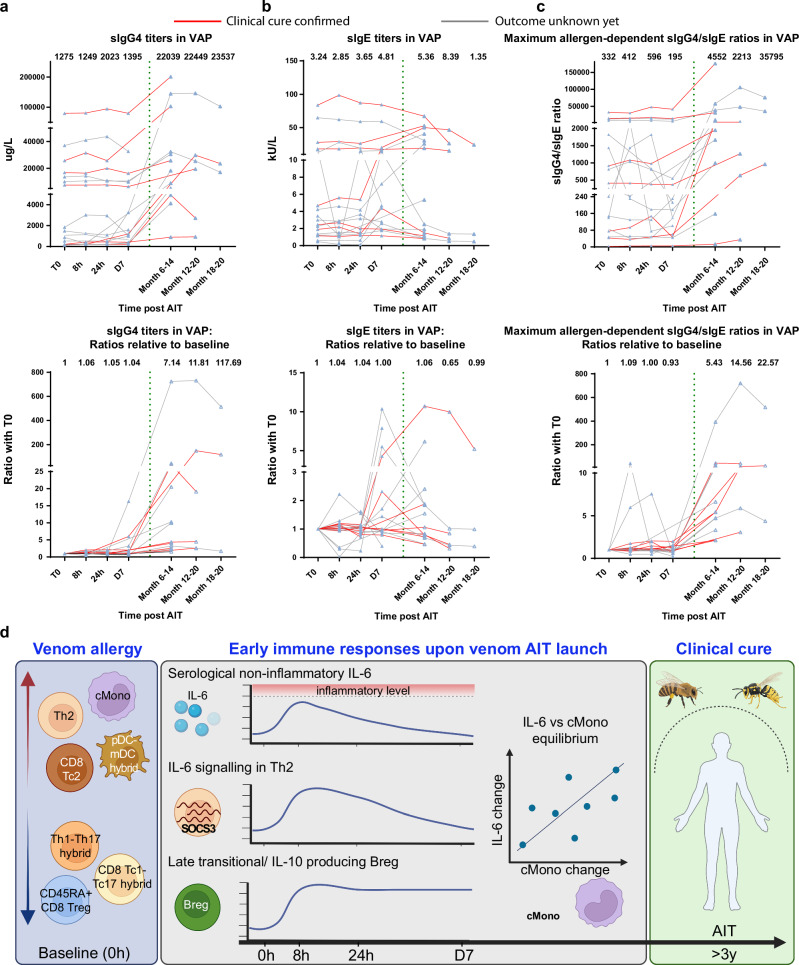
Fig. 6. AIT induces varying sIgG4 responses in VAP.
Titers of sIgG4 (a) and sIgE (b) following AIT launch in VAP. The dashed vertical line separates the long-term follow-up period from the early stage of AIT. Lower panel, the values normalized to baseline. Each triangle represents one measurement of one individual at the given time point. Each line links different time points of one individual. The red (n = 7 independent individuals) or grey (n = 11 independent individuals) line represents a clinically-confirmed case or a patient with still unknown clinical outcome, respectively. c Ratios between sIgG4 and sIgE titers. Lower panel, the values normalized to baseline. We here only displayed the results showing the highest ratios among the responses against two different allergens for each individual patient. The median response level for the samples of the given time point was provided. d Summary of our major discoveries through our systems immunology analysis in VAP following AIT launch. Red upward or blue downward arrow indicates a relatively higher or lower frequency of the indicated immune subset in VAP vs HC at baseline, respectively. VAP, venom allergy patients, n = 18 independent individuals (as provided in Source Data, three patients did not have long-term follow-up samples). Each line in (a-c) links different time points from one individual. AIT, allergen-specific immunotherapy; Breg, IL-10-producing regulatory B cells; CD8+ Tc2, type 2 cytotoxic cells; CD45RA+CD8+ Treg, CD45RA+ regulatory CD8+ T cells; cMono, classical monocytes; pDC-mDC, hybrid plasmacytoid and myeloid dendritic cells (DC); SOCS3, Suppressor of cytokine signaling 3; Tc1-Tc17, hybrid type 1 and type 17 cytotoxic CD8+ T cells; Th1-Th17, hybrid type 1 and type 17 CD4+ T helper cells; Th2, CD4+ type 2 helper T cells. Source data are provided as a Source Data file. Created in BioRender. Demczuk, A. (2024) BioRender.com/l23w020 (panel d).

