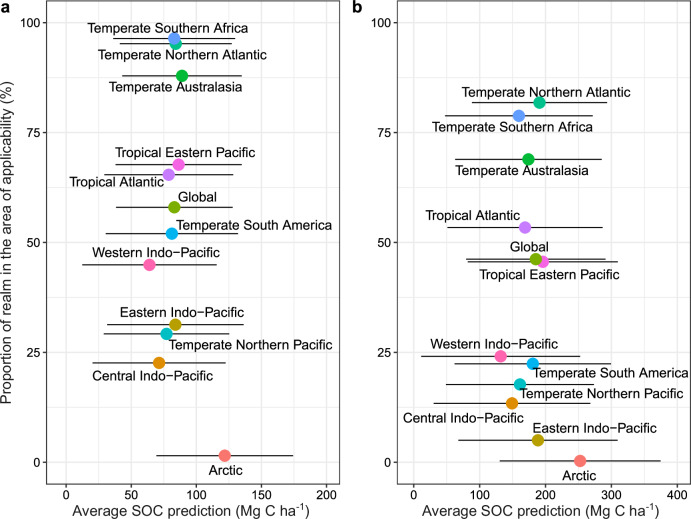
Fig. 3. Realm-level summary statistics of SOC.
In (a) the 0–30 cm soil layer and (b) the 30–100 cm soil layer. For each soil layer (0–30 cm and 30–100 cm), the x-axis shows the average final predicted SOC per unit area (megagrams carbon per hectare (Mg C ha−1)), after masking out areas outside the AOA and the y-axis shows the proportion of the realm within the AOA, i.e. where we enabled the model to learn about the relationship between SOC and the environmental drivers. Whiskers represent the expected model error for each prediction. Colours are mapped to realms, which correspond to the biogeographical realms of the Marine Ecoregions of the World, and the global average.

