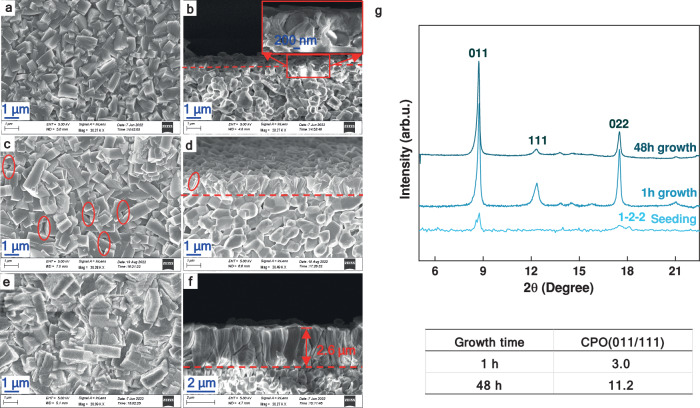
Fig. 2. SEM images and XRD patterns of MOF-303 membranes fabricated by DS method.
SEM images of the membrane after (a, b), seeding (the inset in (b) shows an enlarged view of the seeding layer covering the alumina HF substrate), (c, d) 1-h secondary growth, and (e, f) 48-h. a, c, e are surface images, and (b, d, f) are cross-sectional images of the membrane. The red circles in (c) display the intercrystalline gaps. The red dotted lines in (b, d, f) divide the cross-sections into the HF substrate and MOF layer parts. g XRD patterns and CPO ratios of the membrane.

