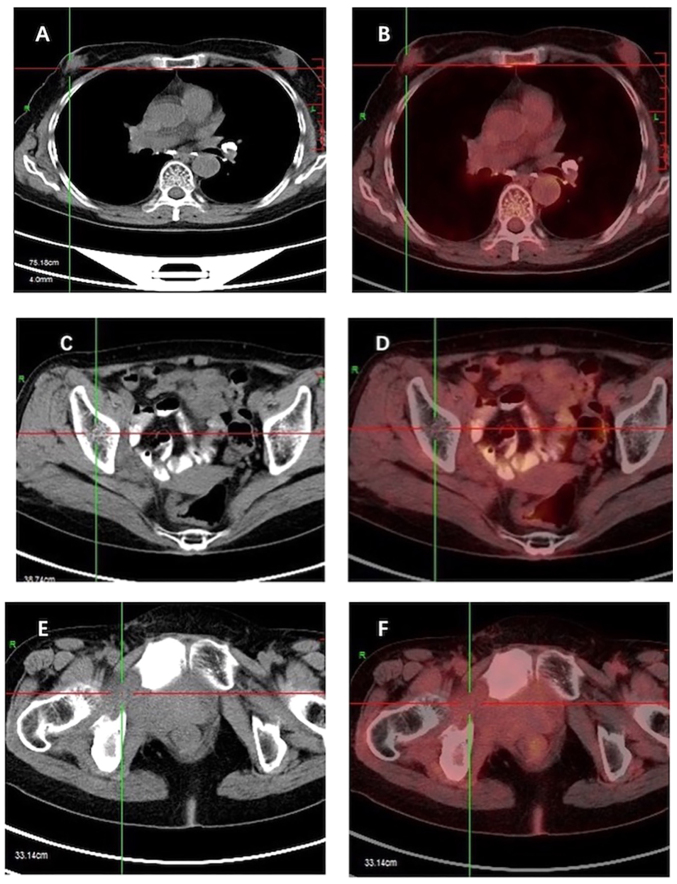
Figure 7.
CT and [18F] FDG PET-CT scans of the breast mass after treatment. (A) Non-contrast axial CT scan demonstrates a clear reduction in the mass in the right breast following chemotherapy, and (B) [18F] FDG PET-CT demonstrates that the metabolism in the right breast has markedly decreased compared with that before treatment. (C) Non-contrast axial CT scan demonstrates increased bone density in the ilium, and (D) [18F] FDG PET-CT demonstrates reduced metabolism in the ilial region. (E) Non-contrast axial CT scan demonstrates the soft tissue mass around the ischium has decreased, and (F) [18F] FDG PET-CT demonstrates decreased metabolism of soft tissue mass around the ischium. CT, computed tomography; [18F] FDG, fluorine-18 fluorodeoxyglucose; PET, positron emission tomography.

