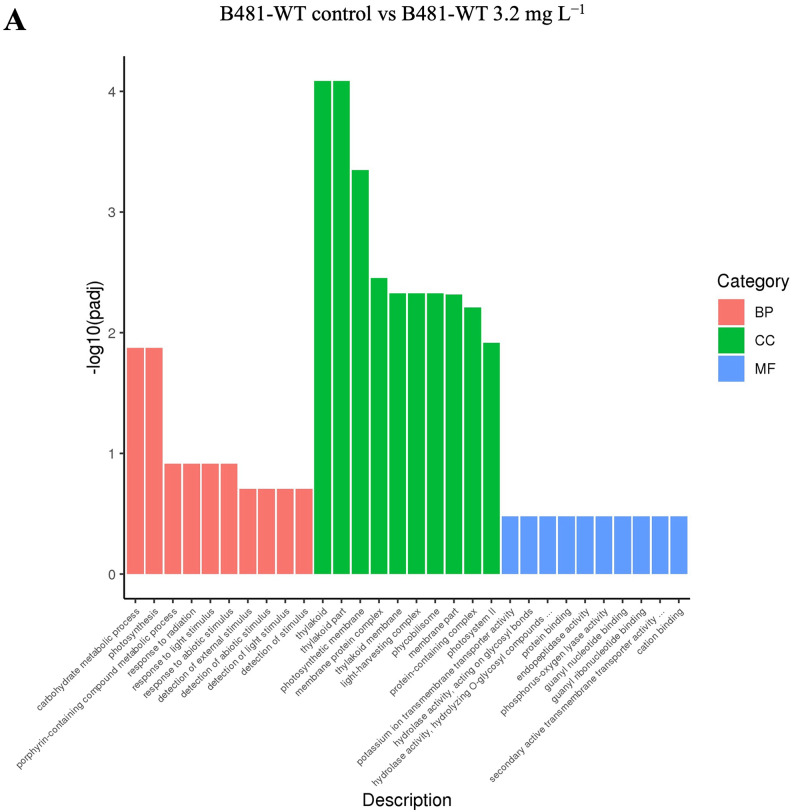
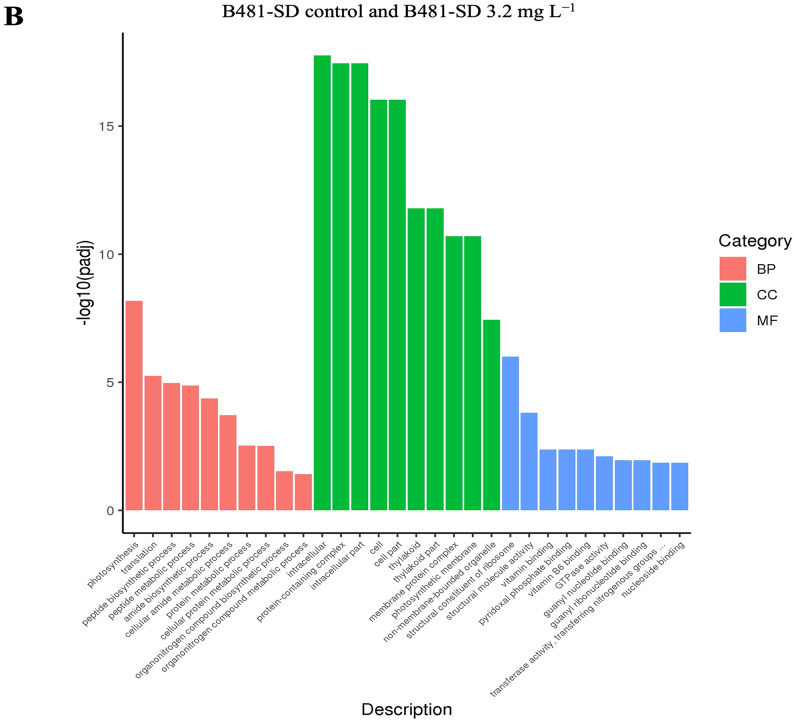
Fig. 6.
Biological Process (BP), Molecular Function (MF), and Cellular Component (CC) groups of GO (gene ontology) in Fremyella diplosiphon (A) B481-WT untreated control versus B481-WT treated with 3.2 mg L−1 nanofer 25s zerovalent nanoparticles-treated (nZVIs), (B) B481-SD control versus B481-SD 3.2 mg L−1 nZVI-treated cultures. The total number of categories in each GO is indicated in parentheses. Fraction of categories (y axis) indicates the ratio of the number of GO categories with higher EC score than each threshold EC score (x axis) to the total number of GO categories.


