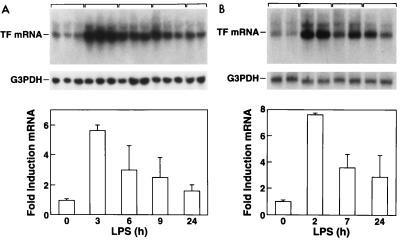
FIG. 1.
LPS induction of TF mRNA in the brain. (A) TF mRNA expression in a three-injection model. Tissues were collected 3, 6, 9, and 24 h after the last dose of LPS. Quantitation of brain TF mRNA was performed by densitometric analysis of the Northern blots. TF mRNA levels were normalized by using G3PDH mRNA levels and expressed as fold induction ± SD. (B) TF mRNA expression in a single-injection model.

