Abstract
In this study, electrospinning was used to fabricate xanthan gum (XF) and thiosemicarbazide/xanthan gum (TXF) nanofibers crosslinked with ferric ions for effective Pb2+ adsorption. The produced nanofibers were investigated using several physicochemical methods. Both XF and TXF demonstrated thermal stability up to 800 °C, with mass losses of 79% and 75%, respectively. TXF had a surface area of 153.4 m2 g−1 and point of zero charge at pH 6.7. ATR-FTIR analysis revealed the existence of surface chemical functional groups such as –NH2, –NH, and –C S owing to thiosemicarbazide reinforcement. XF and TXF displayed maximum adsorption capacities of 211.65 and 289.18 mg g−1 at pH 6, 2.0 g L−1 nanofiber dose, 22 °C, and after 40 min of contact shaking time. The adsorption process was investigated using several nonlinear adsorption models as well as by desorption and reusability investigations. Thermodynamics examination demonstrated the spontaneous, endothermic physisorption of Pb2+ onto XF and TXF. Ethylenediaminetetraacetic acid was selected as the most efficient eluent for Pb2+ removal from the nanofiber surfaces, with desorption efficiencies of 100% and 97% for XF and TXF, respectively. TXF and XF revealed remarkable sustainability, with reductions in adsorption capacities of only 7% and 12% of the initial removal efficiency after 10 cycles of adsorption/desorption, respectively. As a solid adsorbent for the removal of heavy metal cations, the produced TXF nanofiber demonstrated great sustainability and environmental friendliness.
In this study, electrospinning was used to fabricate xanthan gum (XF) and thiosemicarbazide/xanthan gum (TXF) nanofibers crosslinked with ferric ions for effective Pb2+ adsorption.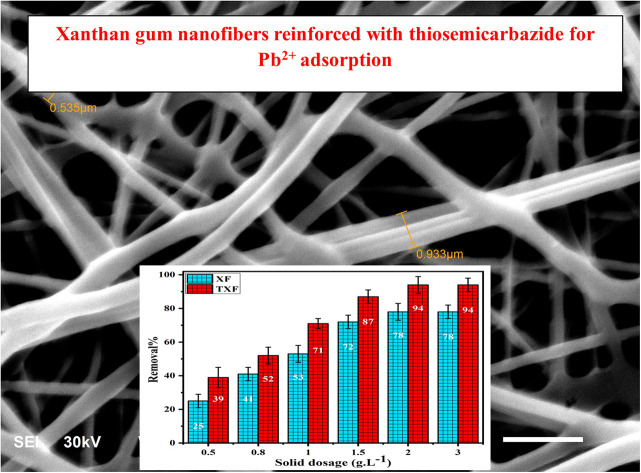
1. Introduction
The primary sources of pollution in our environment are on a huge rise with increasing industrial activity and uncontrolled population growth.1 Heavy metal contamination can put the stability of ecosystems and human health at risk. Lead is a heavy metal that is hazardous to aquatic life and humans. Lead poisoning can affect nearly every organ and system in the human body.2 Lead has significant uses in numerous industrial applications, such as electronics, printing, mining, fuel enhancement, battery manufacturing, and tubing. The US Environmental Protection Agency recommended a maximum lead cation level of 10 μg L−1 for drinking water and 50 μg L−1 for wastewater.3 Lead exposure was reported to be responsible for 8.2% of cardiac diseases associated with hypertension, 5.6% of strokes, 7.2% of global cases of coronary artery disease, and 62.5% of cases of idiopathic mental retardation, according to the Institute for Health Metrics and Evaluation.4 Several water treatment methods, including biological treatment,5 sedimentation,6 ion exchange,7 chemical precipitation,8 membrane filtration,9 coagulation,10 catalysis,11 electrocoagulation,12 and adsorption,3 have been applied to remove lead ions from contaminated water. Adsorption remains one of the most effective, safe, affordable, reusable, and selective methods available for eliminating contaminants from water. Developing ecofriendly biomaterials with better reusability and a higher adsorption capacity is one of the principal challenges in the adsorption process. Natural polymers are readily available macromolecules that are present in nature and have been used in a variety of industries, including food product manufacturing, pharmaceutical and cosmetics sectors, and wastewater treatment. Natural polymers are better than synthetic ones because they are biocompatible, biodegradable, and modifiable. Natural polymers include lipids (triglycerides and cholesterol), terpenes (carotene, phytol, and squalene), proteins (hydrolases, keratin, globulin, myosin, and ependymin), and polysaccharides (glycogen, starch, alginate, chitosan, cellulose, gellan, and xanthan gum).13 Xanthan gum is a naturally occurring polysaccharide with an anionic nature that is primarily produced in aerobic circumstances by Xanthomonas campestris. Xanthan gum comprises a β(1→4)-linked d-glucose main chain and trisaccharide side chains with carboxylate groups (mannose-β(1→4)-glucuronic acid-β(1→2)-mannose-α(1→3)-) connected to alternate glucose parts.14 The higher water solubility of biopolymers represents one of the biggest challenges for their environmental applications. It is necessary for the solid adsorbent used in the aqueous media to be water insoluble in order for to be reused. The issue above can be resolved by forming an insoluble biopolymer matrix containing certain metal cations, such as ferric xanthan gum, potassium carrageenan, and calcium alginate. Also, xanthan gum can be precipitated with certain crosslinking agents, such as sodium trimetaphosphate,15 citric acid,16 epichlorohydrin,17 and ferric ions.18,19
Electrospinning has been developed as a cost-effective, simple, and resourceful method to fabricate nanofibers with an acceptable specific surface area, total pore volume, and adaptable porosity. Therefore, electrospinning has been commonly used as an effective technique to produce numerous biopolymer nanofibers, such as gum Arabic, chitosan, guar gum, alginate, cellulose, and xanthan gum. Fabricated biopolymer nanofibers are potential candidates for various medical and environmental applications.20 Xanthan gum nanofibers need to be modified with a particular surface chemical functional group to increase their adsorption ability. Several experiments have been conducted to alter the surface of xanthan gum, particularly when it only has the functional groups –OH and –COOH. Qiu et al. reported an aminated xanthan gum (XG-NH2) for the effective removal of Cu2+ from an aqueous medium, with a 23.47 mg g−1 maximum adsorption capacity.21 Irfan et al. developed a terpolymeric hydrogel based on xanthan gum, N-isopropyl acrylamide, and acrylic acid with the ability to remove heavy metals and break down dyes.22 Also, composite derived from xanthan gum/amantadine and hydrogels of poly (acrylic acid)/xanthan gum/cloisite semi-interpenetrating networks were fabricated for the efficient removal of methylene blue dye and Ni2+ with maximum adsorptions of 565 and 511.74 mg g−1, respectively.18,23 Nanocomposites of montmorillonite/xanthan gum/sodium alginate,24 zinc oxide nanoparticles-loaded cationic chitosan cryogel/xanthan gum,25 and the physical crosslinking of chitosan and xanthan gum have been reportedly utilized for the removal of malachite green, Cu2+, and Cd2+, with optimum adsorption capacities of 769.23, 25.96, and 152.33 mg g−1, respectively.26 Many authors have proposed the use of electrospun xanthan gum nanofibers along with other materials to produce new types of nanofibers with unique properties. For instance, xanthan gum/chitosan nanofibers were prepared by Shekarforoush et al. as an efficient drug-delivery system for hydrophobic bioactive materials.27 Also, polycaprolactone/xanthan nanofibers and chitin nanofiber-reinforced xanthan gum were constructed for biological and food applications.28,29
To successfully remove the cations of heavy metals, such as Pb2+, a solid adsorbent must be reinforced with a compound that contains heteroatoms that serve as the cations' attractive sites. Thiosemicarbazide, which has four heteroatoms that can attract cations, is a well-known modifiable solid adsorbent that can increase the adsorption capacity. However, to the best of our knowledge, this is the first time that electrospun xanthan gum nanofiber reinforced with thiosemicarbazide has been developed to remove Pb2+ ions from an aqueous medium.
The aim of the present work was to fabricate electrospun xanthan gum nanofiber reinforced with thiosemicarbazide for the optimum removal of Pb2+ from an aqueous medium. The fabricated solid materials were fully characterized using various physicochemical tools, including TGA, XRD, nitrogen adsorption/desorption studies, SEM, ATR-FTIR, and zeta potential investigations at different pH values. The removal of Pb2+ was investigated under different application conditions, including the effect of the initial solution pH, adsorbent dosage, initial adsorbate concentration, shaking time, and adsorption temperature. The nanofibers' reusability was also investigated for sustainability considerations.
2. Experimental section
2.1. Materials
Xanthan gum from Xanthomonas campestris, thiosemicarbazide (99%), ethylenediaminetetraacetic acid (99.5%), and lead nitrate (≥99.95%) were obtained from Sigma Aldrich Co., USA. Sodium hydroxide (97%), hydrochloric acid (37%), nitric acid (70%), ferric chloride hexahydrate (≥98%), and potassium chloride (99.9%) were purchased from Oxford Lab Fine Chem LLP, India. Polyethylene oxide (MW 106 g mol−1) was obtained from Alfa-Aser Co. Ltd, Germany. All the materials were used without further treatment.
2.2. Electrospinning of the nanofibers
2.2.1. Fabrication of the xanthan gum nanofibers
Xanthan gum nanofibers (XF) were formulated according to the method reported by Shekarforoush et al. and Yan et al. with modifications.18,27 The first step was to combine 0.3 g of xanthan gum and 0.1 g of polyethylene oxide in 10 mL of distilled water with continuous stirring with a magnetic stirrer at room temperature to produce a homogeneous and transparent electrospinning aqueous solution. The derived solution was transferred into a 5 mL syringe with a 22 G stainless steel needle. Electrospinning was performed utilizing an electrospinning device (NANON-01A, MECC, Japan) at a temperature of 35 °C and relative humidity of the surrounding air. The needle's end was positioned 15 cm from the receiving plate, with a feed rate of 0.04 mL min−1 at 25 kV. The electrospun nanofibers were vacuum-dried at 45 °C. The dried electrospun nanofiber was soaked in 100 mL of 2% FeCl3 solution for 1 h, then washed several times with distilled water and dried at 60 °C to obtain the XF.
2.2.2. Fabrication of thiosemicarbazide/xanthan gum nanofibers
Thiosemicarbazide/xanthan gum nanofibers (TXF) were fabricated by mixing 0.3 g of xanthan gum, 2 mL (0.25%) of thiosemicarbazide, and 0.1 g of polyethylene oxide in 10 mL of distilled water while stirring with a magnetic stirrer at ambient temperature to generate a homogeneous electrospinning solution. The formed mixture was treated as per the previously reported method for XF preparation and the product was finally labeled as TXF.
2.3. Physicochemical investigation of the fabricated fibers
Characterizing solid materials, including their thermal, textural, and chemical properties, is crucial, particularly if the material is employed in an adsorption process. Thermogravimetric analysis of the xanthan gum nanofiber (XF) and xanthan gum nanofiber reinforced with thiosemicarbazide (TXF) was performed utilizing a thermoanalyzer (SDT Q600, V20.9 Build 20) from room temperature up to 800 °C. TGA curves were obtained utilizing 0.01 g of solid adsorbent with a nitrogen flow rate of 20 mL min−1 and a heating rate of 15 °C min−1.
Employing nitrogen gas adsorption–desorption using a NOVA3200e gas sorption analyzer from Quantachrome Corp., USA, the specific surface area (SBET, m2 g−1), total pore volume (VP, cm3 g−1), and average pore radius (r̄, nm) of XF and TXF were calculated. The examined solid samples (0.05 g) were degassed for 12 h at 10−4 torr and 110 °C before being exposed to N2 gas adsorption.
The X-ray diffraction patterns (XRD) for the fibers were obtained using a Bruker AXS D8 Advance diffractometer, Karlsruhe, Germany. Cu-Kα radiation (λ = 1.54 Å) was utilized as the X-ray source, with 40 kV accelerating voltage and 40 mA current. The scanning rate was adjusted to 2° min−1 in the 2θ range of 10°–40°.
Utilizing a Nicolet Impact 400 D ATR-FTIR apparatus with a ZnSe crystal, ATR-FTIR spectroscopy was used to examine the solid fibers in the 400–4000 cm−1 range.
A Zetasizer Nano ZS90 analyzer from Malvern Instruments Ltd, Malvern, UK was used to obtain the zeta potentials for XF and TXF at various pH levels (2–12). A diluted solution of KCl (0.05 mol L−1) solution as the electrolyte was used in the measurements. The suspension of the electrolyte solution containing the nanofiber powder (0.005 w/v%) was sonicated for 2 min followed by adjusting the required pH values using 0.01 mol L−1 NaOH and/or HCl. The prepared solution was added into a zeta potential cuvette without bubbles. Measurements were repeated three times, and the average values were used in the calculation of pHPZC.
The fabricated solid fibers (XF and TXF) were examined by scanning electron microscopy (SEM) with a J JEOL-JSM 6510LV instrument, Japan. Before the SEM investigations, 3.5 nm of gold was applied to the surfaces of the solid samples using the vacuum evaporation method.
2.4. Adsorption of lead ions
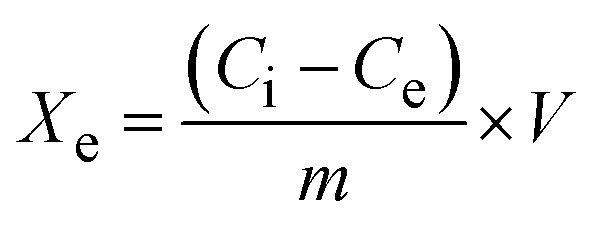
Lead cation adsorption from an aqueous medium was performed via shaking 0.05 g of the fiber with 25 mL of 500 mg L−1 Pb2+ for 40 min at pH 6 and 22 °C. The resultant solution was centrifuged for 10 min and the non-adsorbed residual Pb2+ concentration (Ce, mg L−1) was measured using an atomic absorption spectrophotometer (GBC Sens. AAS). The equilibrium adsorption capacity (Xe, mg g−1) and the removal percentage (R%) were calculated by applying the following equations:
 |
1 |
 |
2 |
where V (L) and m (g) are the volume of the adsorbate solution and the mass of the used fibers, while Ci and Ce (mg L−1) are the initial and final concentrations of Pb2+, respectively. Different adsorption conditions were applied to choose the optimum adsorption conditions, such as pH (2–7), adsorbent dose (0.5–3.0 g L−1), shaking time (5–80 min), initial Pb2+ concentration (40–550 mg L−1), temperature (22–40 °C), and the effect of the ionic strength using different concentrations of KCl solution (μ, 0.2–1.0 mol L−1).
Several nonlinear kinetic, equilibrium, and thermodynamic adsorption models were applied to investigate the efficiency and mechanism of Pb2+ adsorption onto XF and TXF as solid adsorbents.
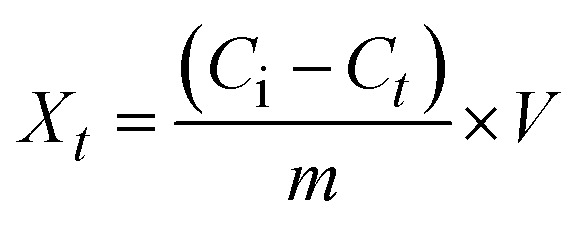
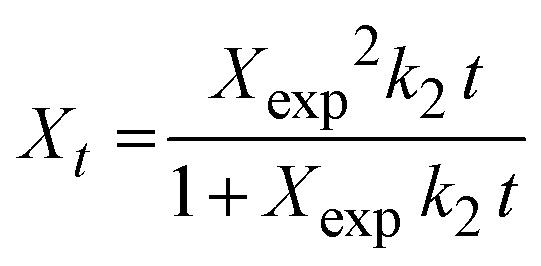
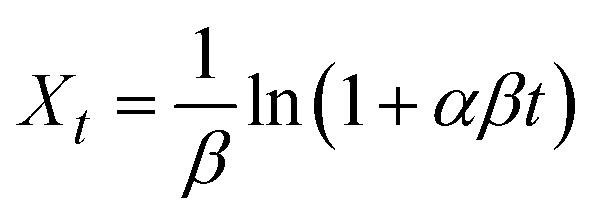
The pseudo-first-order (PFO, eqn (4)), pseudo-second-order (PSO, eqn (5)), Elovich (eqn (6)), and intraparticle adsorption (eqn (7)) kinetic models were applied for investigating Pb2+ adsorption onto XF and TXF as solid adsorbents.
 |
3 |
| Xt = Xexp(1 − e−k1t) | 4 |
 |
5 |
 |
6 |
| Xt = kit0.5 + C | 7 |
where, Xt (eqn (3), mg g−1), k1 (min−1), k2 (g mg−1 min−1), α (mg g−1 min−1), and β (g mg−1) are related to the amount of Pb2+ adsorption at certain times t (min), the pseudo-first-order rate constant, pseudo-second-order rate constant, initial rate of Pb2+ adsorption, and the extent of surface coverage, respectively; and ki (mg g−1 min−0.5) and C are the intraparticle diffusion rate constant and the boundary layer thickness, respectively.
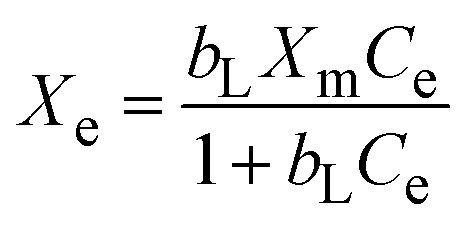
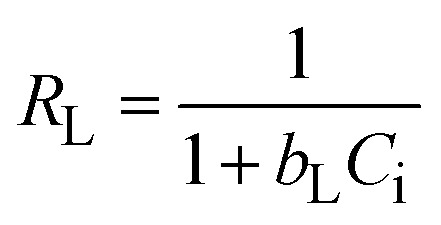
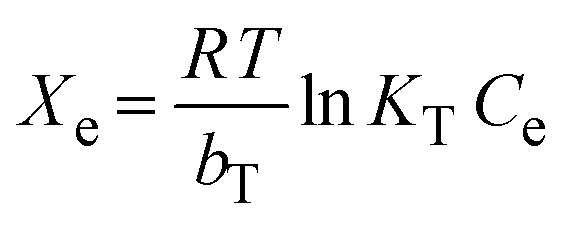
The investigation of the maximum adsorption capacity and equilibrium adsorption were studied by applying different nonlinear adsorption models, such as Langmuir (eqn (8)), Freundlich (eqn (10)), Temkin (eqn (11)), and Dubinin–Radushkevich (eqn (12)).
 |
8 |
 |
9 |
| Xe = KFCe1/n | 10 |
 |
11 |
| Xe = XDRe−KDRε2 | 12 |
 |
13 |
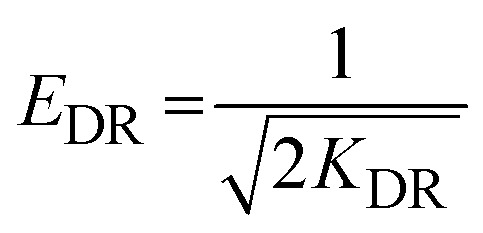
the maximum Langmuir adsorption capacity (Xm, mg g−1), Langmuir constants (bL, L mg−1), and dimensionless separation factor (RL, eqn (9)) could be calculated by plotting the Langmuir nonlinear models. In the equations, KF (L1/n mg1−1/n g−1), n, KT (L g−1), and bT (J mol−1) represent the Freundlich constants that express the capacity and intensity of adsorption, the Temkin parameters related to the equilibrium binding, and heat of adsorption, respectively, while R (8.314 J mol−1 K−1) is the gas adsorption constant. The symbols ε and XDR (mg g−1) represent the greatest capacity of adsorption and the Polanyi potential, respectively. The D–R constant and mean adsorption-free energy are denoted by the terms KDR (eqn (13), mol2 kJ−2) and EDR (kJ mol−1), respectively.
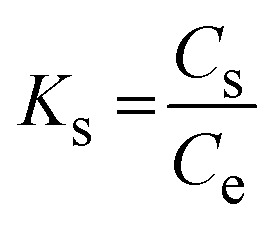
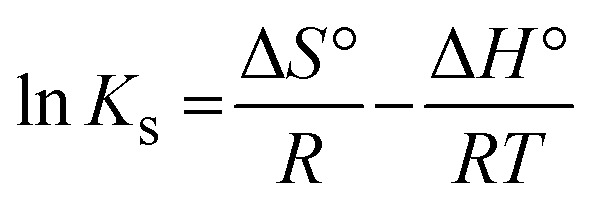
The thermodynamic adsorption parameters were evaluated by the adsorption of Pb2+ onto solid adsorbent nanofibers at 22 °C, 27 °C, 35 °C, and 40 °C using 2 g L−1 as an adsorbent dosage, 500 mg L−1 as the initial Pb2+ concentration, pH 6, and 40 min of contact shaking time. Various thermodynamic models were utilized to calculate the thermodynamic parameters, such as the change in adsorption enthalpy (ΔH°, kJ mol−1) and entropy (ΔS°, kJ mol−1 K−1); while eqn (16) (Gibbs free energy change equation) was utilized for the calculation of the free energy (ΔG°, kJ mol−1). The intercept and slope of the Van't Hoff plot (eqn (15)) were used to calculate the change in enthalpy and entropy. The distribution constant (Ks) of Pb2+ between the solid surface of the fibers and the bulk of the solution (eqn (14)) represents the ability of adsorption and the attractive force of the fibers toward the adsorbate.
 |
14 |
 |
15 |
| ΔG° = ΔH° − TΔS° | 16 |
where Ce, and Cs represent the equilibrium Pb2+ concentration (mg L−1) in the solution and on the solid fiber surface, respectively.
2.5. Desorption and reusability of the nanofibers
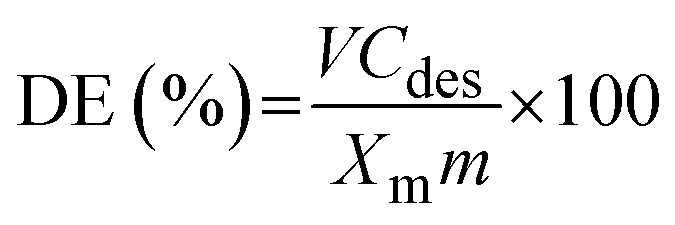
The sustainability of solid adsorbents is an essential factor in determining the suitability of prefabricated solid materials for environmental applications. Then, using various eluents, such as distilled water, 0.1 mol L−1 NaOH, HCl, HNO3, and EDTA, the desorption and reusability of the solid adsorbent nanofibers were investigated. The dried pre-loaded fiber (0.2 g) with Pb2+ was shaken with 100 mL of the eluents for 5 h at 22 °C. After centrifuging the prior mixture, the desorbed Pb2+ concentration (Cdes, mg L−1) was determined, and the desorption efficiency (DE%) was computed with the following equation (eqn (17)).30
 |
17 |
where Xm, V, and m represent the maximum Langmuir adsorption capacity (mg g−1), eluent volume (L), and mass (g) of the adsorbent, respectively.
The reusability of the XF and TXF adsorbents was examined after 10 cycles of Pb2+ adsorption and desorption. Solid nanofibers as adsorbents were used to achieve Pb2+ adsorption at a concentration of 500 mg L−1, an adsorbent dosage of 2 g L−1, pH 6 at 22 °C, and a shaking period of 40 min. After every cycle, the fibers were filtered and cleaned with 50 mL of 0.1 mol L−1 EDTA to desorb the adsorbed Pb2+. Before being used again, the fibers were cleaned with deionized water and dried at 70 °C.
3. Results and discussion
3.1. Nanofiber characterization
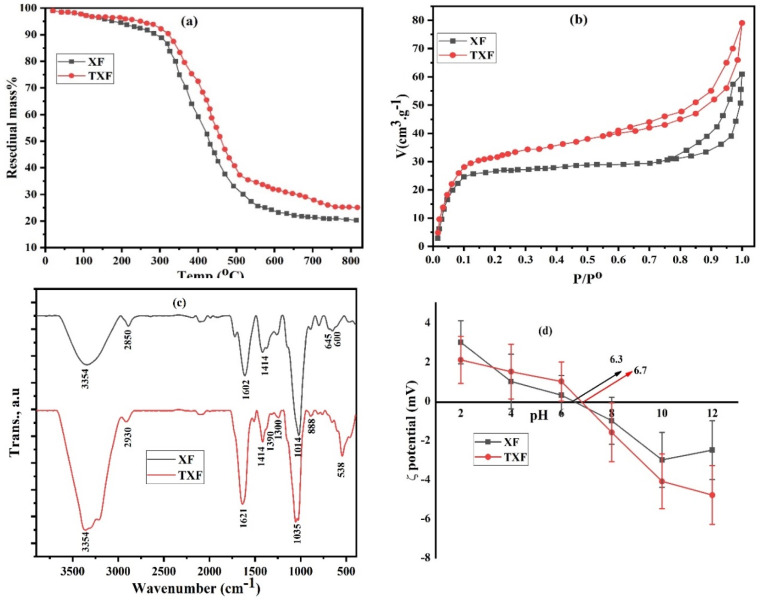
Thermogravimetric analysis (TGA) was performed for XF and TXF and the results are displayed in Fig. 1a. Heating the two fibers to 120 °C resulted in a 2.9% mass loss, which was due to the evaporation of surface adsorbed moisture. The two fibers demonstrated a significant mass loss from 300 °C to 540 °C, which may be attributed to the thermal breakdown of polysaccharide hydrogels (xanthan gum) in addition to thiosemicarbazide in TXF.31 Both XF and TXF revealed 62% and 57% mass losses in the demonstrated heating area, showing that thiosemicarbazide in the xanthan gum matrix improved the thermal stability of the produced nanofiber (TXF). Further increasing the temperature from 540 °C to 800 °C led to further mass losses of 7% and 10% for XF and TXF, which could be related to the pyrolysis or combustion of the nanofibers.32 Up to 800 °C, the synthesized XF and TXF showed total mass losses of 79% and 75%, respectively, demonstrating that TXF had slightly higher thermal stability than XF due to the crosslinking between the thiosemicarbazide groups and xanthan gum functional groups.
Fig. 1. TGA (a), nitrogen adsorption (b), ATR-FTIR (c), and zeta potentials (d) for XF and TXF.
Textural characterization of the two nanofibers was performed by N2 adsorption/desorption experiments at −196 °C, as shown in Fig. 1b. Table 1 presents the specific surface areas, total pore volumes, and pore radii for XF and TXF. The resulting isotherms of XF and TXF revealed type IV isotherms with H3 hysteresis loops, exhibiting capillary coalescence in the porous adsorbent systems and verifying the existence of mesopores on the nanofibers' surfaces.33 As shown in Table 1, the higher specific surface area (SBET) of TXF (153.4 m2 g−1) compared to XF (121.2 m2 g−1) could explain the high porosity, heterogeneity, and successful manufacturing of the TXF nanofibers. The total pore volume (VP) value of TXF (0.1231 cm3 g−1) was greater than that of XF (0.0946 cm3 g−1). As shown in Fig. 1b and Table 1, XF and TXF were mesoporous solids with typical pore radii ranging from 1.56 to 1.61 nm.31
Textural parameters and pHPZC values for the electrospinning nanofibers (XF and TXF).
| Parameters | XF | TXF |
|---|---|---|
| S BET (m2 g−1) | 121.2 | 153.4 |
| V P (cm3 g−1) | 0.0946 | 0.1231 |
| r̄ (nm) | 1.56 | 1.61 |
| pHPZC | 6.3 | 6.7 |
The X-ray diffraction (XRD) patterns for XF and TXF are shown in Fig. S1.† The XRD investigations revealed that the electrospun XF and TXF nanofibers displayed prominent broad peak at diffraction angles of 2θ = 15.28° and 16.09°, indicating their amorphous natures.31 The width and intensity of the characteristic peak of the TXF composite nanofiber were moved to the right compared to pure XF, which might be attributed to the complexation of the thiosemicarbazide heteroatom and hydroxyl groups on the xanthan gum nanofiber. Previous findings about the amorphous form of manufactured nanofibers suggest that those nanofibers will have a greater adsorption capability.
ATR-FTIR spectra of the fabricated nanofibers were collected, as displayed in Fig. 1c, to investigate the surface chemical functional groups. The XF and TXF spectra showed an extensive absorption band at 3354 cm−1, suggesting the intramolecular and intermolecular stretching vibration of the –OH groups, demonstrating their hydrophilic nature.34 XF exhibited an absorption band at 1014 cm−1, attributed to the C–C stretching vibration mode; while in the case of TXF, the same band was shifted to 1035 cm−1 because of the effect of the thiosemicarbazide functional groups. Peaks for the aliphatic –CH, –CH2, and –CH3 groups of different bending and stretching vibrations were observed at 600, 645, 1414, 2850, and 2930 cm−1, respectively.32 XF displayed a peak at 1602 cm−1, which was shifted to 1621 cm−1 in the case of TXF, that could be ascribed to the C O stretching vibration.35 TXF exhibited characteristic peaks at 700–900, 1000–1100, and 1300–1400 cm−1, corresponding to –C S bending vibrations, N–N stretching vibrations, and –C–N stretching vibrations, respectively.36 TXF exhibited stronger absorption peaks, which might be attributed to interactions between thiosemicarbazide functional groups and surrounding xanthan gum groups, such as hydrogen bonding, which can amplify or alter the strength of IR peaks.37
The surface charge of a solid adsorbents plays a crucial role in the adsorption of ions. The pHPZC values for the XF and TXF nanofibers were 6.3 and 6.7, respectively, as shown in Fig. 1d. The difference between the two values was connected to the insertion of the thiosemicarbazide chemical molecule into the TXF nanofiber, which included distinct functional groups, such as –NH2, –NH, and –C S. In addition, the surface of the nanofibers was negatively charged at pH > pHPZC, highlighting the rise in heavy metal cation removal when the pH of the solution increased, wherein electrostatic interactions powered the adsorption process.
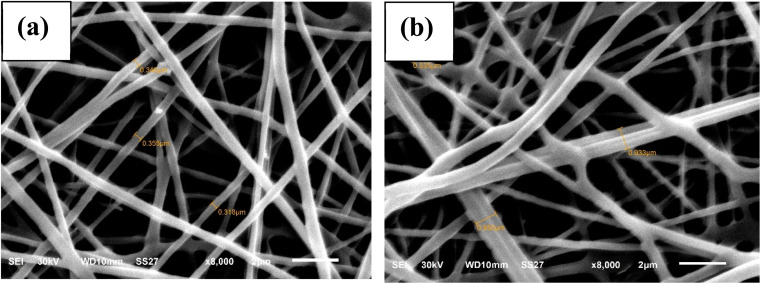
SEM images (Fig. 2) were applied to investigate the morphology of the nanofibers at an 8000× magnification level. These nanofibers' surface morphology was round, homogeneous, and smooth, with an interwoven pore structure and random three-dimensional arrangement.33 The SEM images showed that the average fiber diameters for XF and TXF were 3.4 and 8.1 nm, respectively. The diameter of the TXF nanofibers was approximately 2.4 times greater compared with XF, which may be related to thiosemicarbazide joining the nanofibers together.
Fig. 2. SEM images of (a and b) XF and TXF, respectively.
3.2. Adsorption of lead ions from an aqueous medium
3.2.1. Effect of the solid dosage
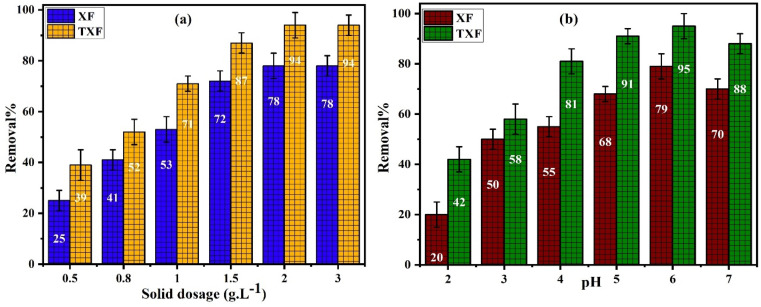
The impact of increasing the adsorbent dose from 0.5 to 3.0 g L−1 on Pb2+ removal% was investigated while keeping the other variables constant, such as the starting Pb2+ concentration (50 mL of 500 mg L−1), pH 6, and shaking time of 80 min. Fig. 3a shows the influence of the adsorbent dose on the R% of Pb2+ by XF and TXF. Raising the solid dose from 0.5 to 2.0 g L−1 caused a 3.12- and 2.4-fold increase in the R% (eqn (2)) for XF and TXF, respectively. The prior finding can be explained by the fact that as the adsorbent concentration increased, more Pb2+ became accessible as abundant adsorption sites.38 However, excessive increase in the adsorbent dose (>2.0 g L−1) did not increase R% because the adsorbent particles aggregate in solution, reducing the surface area and contact with the adsorbate.39 The standard dose for Pb2+ adsorption onto XF and TXF was determined to be 2.0 g L−1.
Fig. 3. (a) Impact of nanofiber dosage and (b) influence of pH on Pb2+ adsorption by XF and TXF (Ci = 500 mg L−1, T = 22 °C, t = 80 min).
3.2.2. Effect of the initial solution pH values
The effect of the initial solution pH on Pb2+ adsorption effectiveness onto XF and TXF was investigated by varying the solution pH throughout the pH 2–7 range at a fixed initial Pb2+ concentration (50 mL of 500 mg L−1), a dose of 2.0 g L−1, and contact shaking duration of 80 min at 22 °C (Fig. 3b). At low pH, the abundant H3O+ and Pb2+ competed for the accessible active sites of the nanofibers, in addition to the expected electrostatic repulsion between Pb2+ ions and the positive charges on the adsorbents, which decreased with increasing the pH value up to 6, as measured by the pHPZC values of XF and TXF.40 The increased capacity of Pb2+ removal at pH 6 was demonstrated by creating electrostatic interactions between the fiber surface with the least number of positive charges and Pb2+ ions, besides the decreased number of H3O+ at elevated pH values. Furthermore, the lone pair of electrons of the hydroxyl, carboxylic, nitrogen, and sulfur functional groups in the samples acted as Lewis bases, which could better interact with the Lewis acidic Pb2+.41 At pH greater than 6, the observed R% dropped by 9% and 7% compared to at pH 6, which could be attributed to the production of non-adsorbable lead ions forms, such as plumbate ions or precipitated hydrolyzable lead ions.42 Consequently, pH 6 was determined to be the optimal pH value for Pb2+ adsorption onto the fabricated nanofibers.
3.2.3. Impact of the contact shaking time
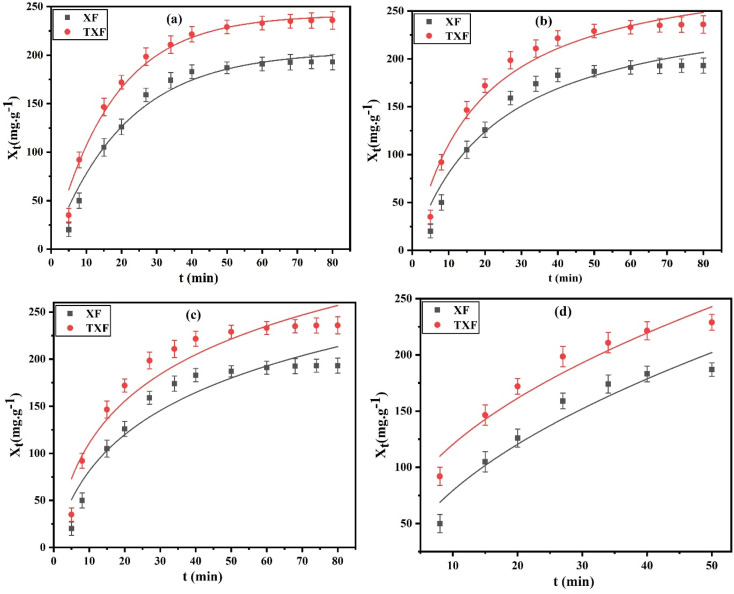
The effect of time and the kinetics analysis were investigated using different batches of 50 mL of 500 mg L−1 Pb2+ at a constant shaking speed of 100 rpm. Each batch was subjected to varying time durations, ranging from 5 to 80 min at pH 6, solid dosage of 2 g L−1, and 22 °C. In this study, the dots on the curves in Fig. 4 reflect the influence of the shaking time on the adsorption capacity (Xt (mg g−1), eqn (3)) of the manufactured XF and TXF for the adsorption of Pb2+. The initial rate of Pb2+ adsorption was rapid in the first 40 min due to the abundance of active sites on the nanofiber surface that attract adsorbate ions. The adsorption rate then became sluggish from 40 to 80 min. Based on the prior result, 40 min was chosen as the optimal adsorption equilibrium time. The PFO (eqn (4)), PSO (eqn (5)), Elovich (eqn (6)), and intraparticle diffusion (eqn (7)) nonlinear models were used to simulate the adsorption features of Pb2+ by XF and TXF to determine the adsorption rate and possible adsorption mechanism. The characteristic curves are shown in Fig. 4a–d, and the associated data are listed in Table 2. Upon analysis of the data in Table 2, a number of interesting aspects could be noted, as follows. (i) The PFO nonlinear kinetic model (Fig. 4a) could adequately describe the adsorption of Pb2+ onto XF and TXF based on the higher correlation coefficients (R2 > 0.9772), lower reduced chi-square values (χ2 < 2.1911), and small difference between the calculated adsorption capacity by the PFO model (Xexp, mg g−1) and the nonlinear Langmuir maximum values (Xm, mg g−1) (1.1% and 1.9% for XF and TXF, respectively). (ii) The rate constant k1 (min−1) for TXF was greater than that for XF, which could be attributed to the greater adsorption capacity for TXF based on its higher surface area and number of surface chemical functional groups resulting from the insertion of thiosemicarbazide in to the TXF matrix.43 (iii) The performance and associated characteristics of the PSO nonlinear kinetic model (Fig. 4b) were worse than PFO, with a poorer correlation coefficient (R2 < 0.9455), more reduced chi-square values (χ2 > 3.4673), and significant difference between Xexp from PSO and Xm from the Langmuir model (15.8% and 4.4% for XF and TXF, respectively). (iv) The Elovich nonlinear kinetic models for XF and TXF (Fig. 4c) showed an average correlation coefficient and reduced chi-square values of 0.9126 and 6.2956, respectively. The calculated rate constant values of PFO (k1, min−1) and β (g mg−1) by the Elovich modeling results supported the trend TXF > XF, representing the higher rate of Pb2+ adsorption and the faster TXF surface coverage. TXF had a greater initial rate of Pb2+ adsorption (α, 23.9053 mg g−1 min−1) compared to XF (α, 14.3792 mg g−1 min−1), indicating the faster adsorption of Pb2+ onto TXF when compared with XF. (v) The intraparticle diffusion plot (Fig. 4d) revealed acceptable nonlinear regression coefficients and lowered chi-square values, as indicated in Table 2, confirming their proper application. The presence of the intercept (C, 2.2002 and 21.1811) proved that neither intraparticle diffusion nor film diffusion were only the rate-controlling platforms, as surface adsorption and external mass transfer also played important roles in the adsorption of Pb2+ onto the fabricated nanofibers. The rate constant value for intraparticle diffusion (ki, mg g−1 min−0.5) for TXF (35.0181) was greater than that for XF (28.4174), indicating the strong affinity between Pb2+ and the additional chemical functional groups on the surface of TXF.3
Fig. 4. (a) PFO, (b) PSO, (c) Elovich, and (d) intraparticle diffusion nonlinear plots for Pb2+ adsorption by XF and TXF (Ci = 500 mg L−1, T = 22 °C, t = 80 min, pH 6, nanofiber dosage = 2 g L−1).
Kinetic and equilibrium parameters for the adsorption of Pb2+ onto XF and TXF at 22 °C.
| Models | Parameters | XF | TXF |
|---|---|---|---|
| PFO | X exp (mg g−1) | 214.01 | 283.59 |
| k 1 (min−1) | 0.0481 | 0.0583 | |
| R 2 | 0.9772 | 0.9892 | |
| χ 2 | 2.1911 | 1.6235 | |
| PSO | X exp (mg g−1) | 245.07 | 276.27 |
| k 2 (g mg−1 min−1) × 10−4 | 1.6287 | 1.9018 | |
| R 2 | 0.9406 | 0.9455 | |
| χ 2 | 3.9668 | 3.4673 | |
| Elovich | α (mg g−1 min−1) | 14.3792 | 23.9053 |
| β (g mg−1) | 0.0121 | 0.0135 | |
| R 2 | 0.9073 | 0.9179 | |
| χ 2 | 6.1984 | 6.3928 | |
| Intraparticle diffusion | k i (mg g−1 min−1/2) | 28.4174 | 35.0181 |
| C | 2.2002 | 21.1811 | |
| R 2 | 0.9088 | 0.9229 | |
| χ 2 | 3.9621 | 2.9188 | |
| Langmuir | X m (mg g−1) | 211.65 | 289.18 |
| b (L mg−1) | 0.0398 | 0.1084 | |
| R L | 0.0712 | 0.0189 | |
| R 2 | 0.9661 | 0.9693 | |
| χ 2 | 4.5420 | 3.5382 | |
| Freundlich | 1/n | 0.4223 | 0.2674 |
| K F (L1/n mg1−1/n g−1) | 30.7821 | 83.0821 | |
| R 2 | 0.8802 | 0.8521 | |
| χ 2 | 16.0434 | 17.0502 | |
| Temkin | b T (J mol−1) | 40.8121 | 43.9378 |
| K T | 0.3247 | 1.4342 | |
| R 2 (L g−1) | 0.9613 | 0.9313 | |
| χ 2 | 5.1869 | 10.2207 | |
| Dubinin–Radushkevich | X DR (mg g−1) | 193.09 | 236.08 |
| E DR (kJ mol−1) | 0.1316 | 0.1617 | |
| R 2 | 0.9449 | 0.9577 | |
| χ 2 | 7.3837 | 4.8748 |
3.2.4. Impact of the initial pollutant concentration
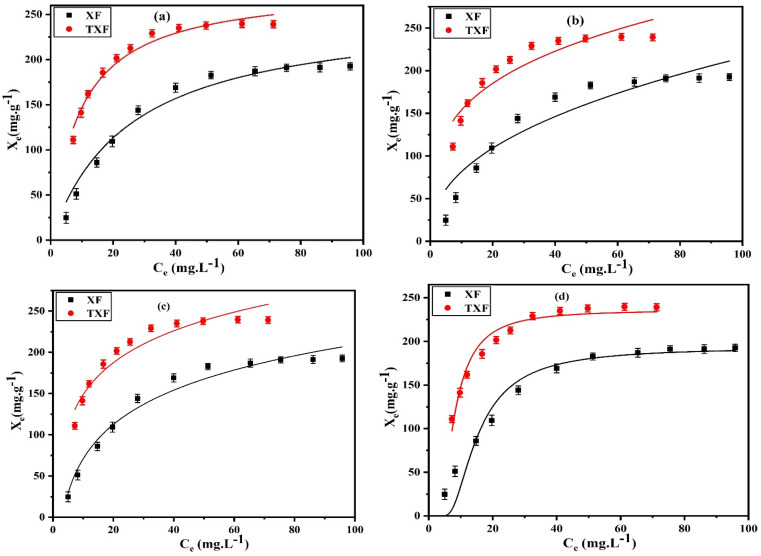
The static adsorption of Pb2+ from aqueous solution was investigated using XF and TXF nanofibers at concentrations ranging from 40 to 550 mg L−1 as the initial adsorbate concentration, a 2 g L−1 nanofiber dose, pH 6, at 22 °C, and 40 min of contact shaking time. Fig. 5a–d show the equilibrium adsorption isotherm points (represented by dots) as well as the nonlinear Langmuir (eqn (8)), Freundlich (eqn (10)), Temkin (eqn (11)), and Dubinin–Radushkevich (eqn (12)) models. The related parameters are summarized in Table 2. The monotonic approach to a limited adsorption capacity was determined by the adsorption points of the isotherms that exhibited a typical L-type isotherm.44 The experimental results suggest that the adsorption features increased with increasing the Pb2+ concentration, while the rate of development decreased at higher concentrations. The adsorption capacities initially increased rapidly due to the abundance of vacant adsorption sites at reduced concentrations. As the concentration was increased, the adsorption rate decreased because the adsorption sites became more saturated.45 The nonlinear Langmuir model had higher R2 values (ranging from 0.9661 to 0.9693) than the Freundlich model (ranging from 0.8521 to 0.8802). Moreover, the Langmuir model had lower χ2 values (3.5382 to 4.5420) than the Freundlich nonlinear isotherm model (16.0434 to 17.0502), indicating that the Langmuir model better fitted the isotherm data for Pb2+ adsorption onto the XF and TXF nanofibers. The maximum Langmuir adsorption capacity (Xm, mg g−1) of TXF (289.18) was approximately 77.53 mg g−1 higher than that of XF (211.65), which could be attributed to TXF's larger surface area when compared to that of XF, as well as the presence of different hetero Lewis basic functional groups derived from thiosemicarbazide in TXF (–NH2, –NH, –C S), which can attract Lewis acidic Pb2+ ions.46 The separation factors (eqn (9), RL, 0.0189–0.0712) for Pb2+ adsorption onto XF and TXF showed that the adsorption process was favorable. The previous result was also confirmed by the 1/n values proved by the Freundlich model (1/n < 1).38 The Temkin and D–R isotherm models were beneficial for modeling Pb2+ adsorption due to their larger R2 (>0.9313) and acceptable χ2 values. The bT values (ranging from 40.8121 to 43.9378 J mol−1) were lower than 80 kJ mol−1, indicating that Pb2+ adsorption on XF and TXF occurred by a physisorption process.3 The higher KT (L g−1) value for TXF, which was 4.5 times higher than that for XF, indicated that Pb2+ adsorption on the TXF surface occurred with a stronger linkage than on XF. The XDR values of the D–R isotherm were in good agreement with the order of Xm with the Langmuir model, with discrepancies of approximately 8.7% and 18.3% for XF and TXF, respectively. The adsorption process was physisorption in nature, since the predicted EDR (kJ mol−1) was less than 8 kJ mol−1.47
Fig. 5. (a) Langmuir, (b) Freundlich, (c) Temkin, and (d) D–R nonlinear plots for Pb2+ adsorption by XF and TXF (Ci = 40–550 mg L−1, T = 22 °C, t = 40 min, pH 6, fiber dosage = 2 g L−1).
3.2.5. Effect of the applied adsorption temperature
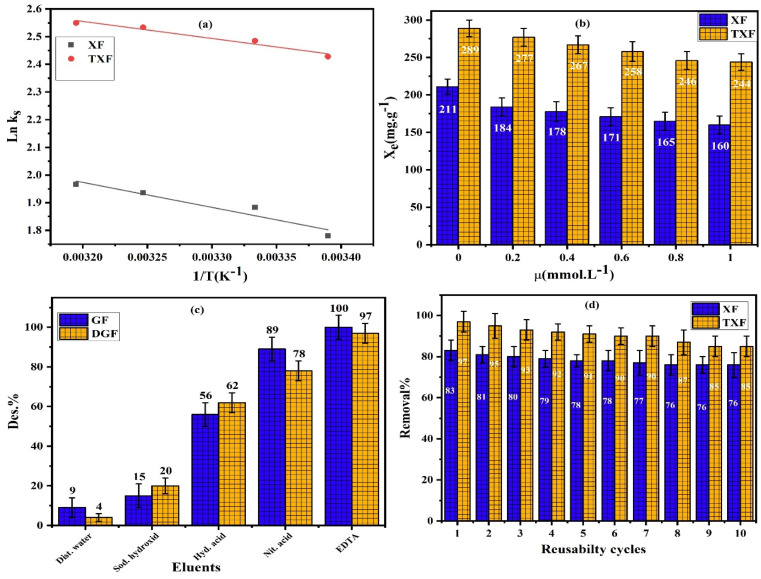
The thermodynamic parameters were derived by examining the influence of temperature on Pb2+ adsorption at 22 °C, 27 °C, 35 °C, and 40 °C using a static adsorption control of a 2 g L−1 dose, pH 6, 40 min contact shaking time, and 500 mg L−1 initial adsorbate concentration. The obtained Van't Hoff plots are shown in Fig. 6a, and the calculated thermodynamic parameters are provided in Table 3. The experimental data well matched the Van't Hoff model, with higher R2 values (>0.9651). The endothermic adsorption of Pb2+ by XF and TXF was indicated by the ΔH° values (5.142–7.510 kJ mol−1).48 The positive ΔS° values indicate that the adsorption process involved an increased affinity of the adsorbate ions for the solid surface and increased unpredictability at the solid/liquid interface in aqueous solution. Additionally, the ΔG° values (−4.585 to −6.752 kJ mol−1) suggested that the adsorption of Pb2+ was spontaneous. The computed ΔG° values ranged from 0 to −20 kJ mol−1 at various temperatures, demonstrating the physisorption process.49 Increasing the temperature from 295 K to 313 K during Pb2+ adsorption resulted in a drop in ΔG°, indicating that the process became more spontaneous and beneficial at elevated temperatures.
Fig. 6. (a) Van't Hoff plot, (b) effect of ionic strength, (c) desorption, and (d) reusability studies for Pb2+ adsorption by XF and TXF (Ci = 500 mg L−1, t = 40 min, pH 6, nanofiber dosage = 2 g L−1).
Thermodynamic parameters for Pb2+removal by XF and TXF.
| Adsorbents/parameters | R 2 | ΔH° (kJ mol−1) | ΔS° (kJ mol−1 K−1) | –ΔG° (kJ mol−1) | |||
|---|---|---|---|---|---|---|---|
| 295 K | 300 K | 308 K | 313 K | ||||
| XF | 0.9651 | 7.510 | 0.041 | 4.585 | 4.790 | 5.118 | 5.323 |
| TXF | 0.9763 | 5.142 | 0.038 | 6.068 | 6.258 | 6.562 | 6.752 |
3.2.6. Impact of the initial solution ionic strength
The influence of the ionic strength was examined in the presence of different amounts of KCl used to vary the solution ionic strength (μ, mol L−1) from 0.2 to 1.0 for the adsorption of Pb2+ at 22 °C, pH 6, 500 mg L−1, 2 g L−1 solid nanofiber dose, and 40 min of adsorption. Fig. 6b depicts the influence of the ionic strength on the adsorption process. When we compared the maximum adsorption capacities of XF and TXF toward Pb2+ in the absence and presence of an adsorbate solution with an ionic strength of 1.0 mol L−1, we noticed that XF and TXF's adsorption capacity dropped by 24.2% and 15.65%, respectively. The decrease in adsorption features with increasing ionic strength could be attributed to competition for the surface active sites between Pb2+ and the added electrolyte cations (K+), with more competitive ions having a higher chance of occupying the adsorption sites. When we compared the ionic mobility of K+ (7.62 × 10⁻⁸ m2 V−1 s−1) and Pb2+ (5.89 × 10⁻⁸ m2 V−1 s−1) ions, we observed that K+ ions were about 1.29 times easier to move than Pb2+ at the examined temperature in the aqueous medium, suggesting that potassium ions were better adsorbed than lead ions. In addition, a rise in electrolyte concentration can result in the electrolyte ions blocking the surface negative charges, reducing the quantity of Pb2+ that can be adsorbed. Furthermore, foreign ions can greatly increase the thickness of the diffuse electric double layer that covers the adsorbents and Pb2+ in solution, inhibiting Pb2+ ions and adsorbent particles from moving closer together, thereby lowering their electrostatic attraction and reducing the adsorption process.50–52
3.2.7. Desorption and reusability of the nanofibers
Desorption tests were performed on the Pb2+-pre-loaded XF and TXF solid adsorbent nanofibers in several eluent solutions with distilled water and 0.1 mol L−1 sodium hydroxide, hydrochloric acid, nitric acid, and ethylenediaminetetraacetic acid to determine which desorbing agent had the highest recovery ratio. As indicated in Fig. 6c, EDTA exhibited the highest desorption percentage, with 100% and 97% desorption in the case of XF and TXF, whereas distilled water had the lowest desorption efficiency (9% and 4%, respectively). The higher DE% of EDTA could be related to the higher stability constant of the PbY−4 water-soluble complex (1.1 × 10¹⁸). Consequently, EDTA was chosen as the most suitable desorbing eluent for Pb2+ from the nanofibers' surfaces.
The produced nanofibers' reusability and sustainability were tested after 10 cycles of Pb2+ adsorption and desorption using EDTA as an eluent. Fig. 6d shows that XF and TXF lost only 7% and 12% of their removal efficiency after 10 cycles of adsorption/desorption, respectively. This decline in efficiency could be attributed to the loss of certain surface active sites as well as possible fiber coagulation, which would result in a decrease in surface area.
3.3. Comparison of the efficiency of TXF with other adsorbents
When comparing TXF's adsorption capacity to that of other materials for the removal of Pb2+, Table 4 shows that TXF had a greater adsorption capacity.3,53–57 TXF nanofibers are a good adsorbent for water treatment because of their unique properties, which include a relatively higher surface area, great mechanical strength, outstanding adsorption efficiency, reusability, and ease of regeneration. These characteristics make TXF an important and creative option for contemporary water treatment operations.
TXF's adsorption capacity in comparison to other adsorbents.
| Adsorbents | Adsorption conditions | X m (mg g−1) | Ref. |
|---|---|---|---|
| Araucaria gum/calcium alginate composite beads | pH 5, t = 10 min, T = 25 °C | 149.95 | 3 |
| Terephthalate-ZnAl-LDH | pH 5, t = 10 min, T = 25 °C | 124.00 | 53 |
| Polyaniline alginate nanofibers | pH 5, t = 10 min, T = 25 °C | 202.00 | 54 |
| CDs/Al2O3 nanofibers nanocomposite | pH 6, t = 100 min, T = 25 °C | 177.83 | 55 |
| DTPA-modified chitosan/polyethylene oxide nanofibers | pH 5, t = 50 min, T = 25 °C | 142.00 | 56 |
| Cellulose nanoparticles/chitosan composite | pH 6.5, t = 120 min, T = 47 °C | 221.10 | 57 |
| TXF | pH 6, t = 40 min, T = 22 °C | 289.18 | [This work] |
4. Conclusion
Ecofriendly nanofibers were created utilizing the electrospinning process, with xanthan gum used as a biological macromolecule polymer and ferric ions for crosslinking, leading to xanthan gum fibers (XF). Thiosemicarbazide was employed to reinforce the produced xanthan gum nanofiber, increasing the surface Lewis basic functional groups and hence the removal efficiency toward heavy metal cations of the reinforced fiber (TXF). The customized fibers revealed acceptable thermal, chemical, and textural properties, promoting their environmental applications, particularly for the adsorption of hazardous heavy metal cations. The insertion of thiosemicarbazide molecules into the texture of xanthan gum (XF) resulted in thiosemicarbazide/xanthan gum nanofibers (TXF) with an increased surface area, advanced chemical functional groups, and adequate thermal stability. The developed TXF demonstrated a greater adsorption capability for cations, which was endothermic, spontaneous, and physisorption in nature. The adsorption of heavy metal cations from aqueous media is an important process that necessitates precise parameter adaptation. The adsorbent dose, starting solution pH, contact shaking duration, adsorption temperature, and the starting ionic strength of the adsorbate solution are all critical parameters. The optimum adsorption conditions were investigated herein and found to be pH 6, 2.0 g L−1, 40 min, a properly increased temperature, and a decreased solution ionic strength. The generated nanofibers were found to be reusable, with a minor loss in adsorption effectiveness of no more than 12% even after 10 cycles of application. The biopolymer nanofibers were demonstrated to be safe, easy to use, efficient, and sustainable. The proposed ecofriendly nanofibers have potential as a nanomaterial for a variety of environmental applications.
Data availability
Data are available upon reasonable request.
Author contributions
[A. F. Hassan and R. Ghubayra]: conceptualization and methodology, [I. Mousa and M. M. M. Madkhal]: formal analysis and investigation, [A. F. Hassan and A-N. M. A. Alaghaz]: writing-original draft preparation, data handling, and analysis of data.
Conflicts of interest
The authors declare that they have no known competing financial interests or personal relationships that could have appeared to influence the work reported in this work.
Supplementary Material
Electronic supplementary information (ESI) available. See DOI: https://doi.org/10.1039/d4ra06364c
References
- Malik H. Qureshi U. A. Muqeet M. Mahar R. B. Ahmed F. Khatri Z. Environ. Sci. Pollut. Res. 2018;25:3557–3564. doi: 10.1007/s11356-017-0706-7. [DOI] [PubMed] [Google Scholar]
- Mazumder M. A. J. Chowdhury I. R. Chowdhury S. Al-Ahmed A. Environ. Sci. Pollut. Res. 2022;29:54432–54447. doi: 10.1007/s11356-022-19585-1. [DOI] [PubMed] [Google Scholar]
- Khoj M. A. Hassan A. F. Awwad N. S. Ibrahium H. A. Shaltout W. A. Int. J. Biol. Macromol. 2024;255:128234. doi: 10.1016/j.ijbiomac.2023.128234. [DOI] [PubMed] [Google Scholar]
- Neskoromnaya E. A. Khamizov R. K. V Melezhyk A. Memetova A. E. Mkrtchan E. S. V Babkin A. Colloids Surf., A. 2022;655:130224. [Google Scholar]
- Chen Z. Liu H. Wang H. Liu Y. Wei Z. Fuel. 2024;355:129500. [Google Scholar]
- Szabó Z. Broda B. Marosfői B. Kováts A. J. Power Sources. 2021;513:230547. [Google Scholar]
- Rong Y. Yan W. Wang Z. Hao X. Guan G. J. Hazard. Mater. 2022;437:129366. doi: 10.1016/j.jhazmat.2022.129366. [DOI] [PubMed] [Google Scholar]
- Xu Z. Gu S. Rana D. Matsuura T. Lan C. Q. J. Water Process Eng. 2021;41:101987. [Google Scholar]
- Kim D. Lim D.-S. Lee H.-J. Kim I.-C. Kwon Y.-N. Myung S. J. Memb. Sci. 2022;663:121031. [Google Scholar]
- Pang F. M. Kumar P. Teng T. T. Mohd Omar A. K. Wasewar K. L. J. Taiwan Inst. Chem. Eng. 2011;42:809–815. [Google Scholar]
- Gao X. Meng X. Processes. 2019;9(10):1729–1738. [Google Scholar]
- Ano J. Koné H. Yapo N. S. Drogui P. Yao K. Adouby K. J. Mater. Environ. Sci. 2023;14:173–183. [Google Scholar]
- Soares R. M. D. Siqueira N. M. Prabhakaram M. P. Ramakrishna S. Mater. Sci. Eng., C. 2018;92:969–982. doi: 10.1016/j.msec.2018.08.004. [DOI] [PubMed] [Google Scholar]
- Melton L. D. Mindt L. Rees D. A. Carbohydr. Res. 1976;46:245–257. doi: 10.1016/s0008-6215(00)84296-2. [DOI] [PubMed] [Google Scholar]
- Tao Y. Zhang R. Xu W. Bai Z. Zhou Y. Zhao S. Xu Y. Yu D. Food Hydrocolloids. 2016;52:923–933. [Google Scholar]
- Bueno V. B. Bentini R. Catalani L. H. Petri D. F. S. Carbohydr. Polym. 2013;92:1091–1099. doi: 10.1016/j.carbpol.2012.10.062. [DOI] [PubMed] [Google Scholar]
- Alupei I. C. Popa M. Hamcerencu M. Abadie M. J. M. Eur. Polym. J. 2002;38:2313–2320. [Google Scholar]
- Li Y. Liu Z. Wan X. Xie L. Chen H. Qu G. Zhang H. Zhang Y.-F. Zhao S. Int. J. Biol. Macromol. 2023;241:124640. doi: 10.1016/j.ijbiomac.2023.124640. [DOI] [PubMed] [Google Scholar]
- Kang M. Oderinde O. Liu S. Huang Q. Ma W. Yao F. Fu G. Carbohydr. Polym. 2019;203:139–147. doi: 10.1016/j.carbpol.2018.09.044. [DOI] [PubMed] [Google Scholar]
- Silvestri D. Mikšíček J. Wacławek S. Torres-Mendieta R. Padil V. V. T. Černík M. Int. J. Biol. Macromol. 2019;124:396–402. doi: 10.1016/j.ijbiomac.2018.11.243. [DOI] [PubMed] [Google Scholar]
- Cui S. Li Y. Deng D. Zeng L. Yan X. Qian J. Luo L. RSC Adv. 2016;6:2632–2640. [Google Scholar]
- Shah L. A. Bilal M. Faizan S. Ye D. Ullah M. Polym. Bull. 2024;81:5313–5328. [Google Scholar]
- Esmaeildoost F. Shahrousvand M. Goudarzi A. Bagherieh-Najjar M. B. J. Polym. Environ. 2022;30:4271–4286. [Google Scholar]
- Rahmani M. Dadvand Koohi A. Polym. Bull. 2022;79:8241–8267. [Google Scholar]
- El-Kholy S. A. Radwan E. K. El-Naggar M. E. El-Wakeel S. T. El-Tantawy El Sayed I. J. Environ. Chem. Eng. 2023;11:110652. [Google Scholar]
- Rahmatpour A. Alizadeh A. H. Int. J. Biol. Macromol. 2024;266:131394. doi: 10.1016/j.ijbiomac.2024.131394. [DOI] [PubMed] [Google Scholar]
- Shekarforoush E. Ajalloueian F. Zeng G. Mendes A. C. Chronakis I. S. Mater. Lett. 2018;228:322–326. [Google Scholar]
- Sheikhzadeh S. Alizadeh Khaledabad M. Almasi H. J. Polym. Environ. 2023;31:1536–1552. [Google Scholar]
- Kadokawa J. Noguchi S. Gotanda T. Kawano A. Yamamoto K. Polym. Bull. 2020;77:4095–4103. [Google Scholar]
- Teodoro F. S. Elias M. M. C. Ferreira G. M. D. Adarme O. F. H. Savedra R. M. L. Siqueira M. F. da Silva L. H. M. Gil L. F. Gurgel L. V. A. J. Colloid Interface Sci. 2018;512:575–590. doi: 10.1016/j.jcis.2017.10.083. [DOI] [PubMed] [Google Scholar]
- Wang Y. Wang H. Li L. Jia L. Microporous Mesoporous Mater. 2022;336:111857. [Google Scholar]
- Dhakate S. R. Gupta A. Chaudhari A. Tawale J. Mathur R. B. Synth. Met. 2011;161:411–419. [Google Scholar]
- Berenjian A. Maleknia L. Chizari Fard G. Almasian A. J. Taiwan Inst. Chem. Eng. 2018;86:57–72. [Google Scholar]
- Putra B. U. Hardiningtyas S. D. Hastuti N. Ramadhan W. Uju Razi M. A. Agustini L. Mater. Today Commun. 2024;38:108248. [Google Scholar]
- Cai R. Zhou Y. Hu J. Lu J. Fan X. Chen Y. Ding M. Rong J. Liu W. Chen Y. J. Water Process Eng. 2022;50:103303. [Google Scholar]
- Alnoman R. B. Aljohani M. S. Alharbi H. Y. Elsayed N. H. Monier M. React. Funct. Polym. 2024;202:105963. [Google Scholar]
- Silverstein R. M. Bassler G. C. J. Chem. Educ. 1962;39:546. [Google Scholar]
- Eltaweil A. S. Mohamed H. A. Abd El-Monaem E. M. El-Subruiti G. M. J. Mol. Liq. 2024:125275. [Google Scholar]
- Dhanya V. Rajesh N. Groundwater Sustainable Dev. 2024;26:101209. [Google Scholar]
- Zhang C. Sui J. Li J. Tang Y. Cai W. Chem. Eng. J. 2012;210:45–52. [Google Scholar]
- Li J. Lin G. Tan F. Fu L. Zeng B. Wang S. Hu T. Zhang L. J. Colloid Interface Sci. 2023;651:659–668. doi: 10.1016/j.jcis.2023.08.022. [DOI] [PubMed] [Google Scholar]
- Saha Chowdhury S. Bera B. Thakare A. De S. Sep. Purif. Technol. 2023;325:124646. [Google Scholar]
- Patiño-Ruiz D. Bonfante H. De Ávila G. Herrera A. Environ. Nanotechnol., Monit. Manage. 2019;12:100243. [Google Scholar]
- Algieri V. Tursi A. Costanzo P. Maiuolo L. De Nino A. Nucera A. Castriota M. De Luca O. Papagno M. Caruso T. Ciurciù S. Corrente G. A. Beneduci A. Chemosphere. 2024;355:141891. doi: 10.1016/j.chemosphere.2024.141891. [DOI] [PubMed] [Google Scholar]
- Hassan A. F. El-Naggar G. A. Braish A. G. Abd El-Latif M. M. Shaltout W. A. Elsayed M. S. Int. J. Biol. Macromol. 2023;249:126075. doi: 10.1016/j.ijbiomac.2023.126075. [DOI] [PubMed] [Google Scholar]
- Parr R. G. Pearson R. G. J. Am. Chem. Soc. 1983;105:7512–7516. [Google Scholar]
- Kamal K. H. Dacrory S. Ali S. S. M. Ali K. A. Kamel S. Desalin. Water Treat. 2019;165:281–289. [Google Scholar]
- Benhiti R. Ait Ichou A. Aboussabek A. Carja G. Zerbet M. Sinan F. Chiban M. Chemosphere. 2023;341:140127. doi: 10.1016/j.chemosphere.2023.140127. [DOI] [PubMed] [Google Scholar]
- Hassan A. F. El-Naggar G. A. Esmail G. Shaltout W. A. Appl. Surf. Sci. Adv. 2023;13:100388. [Google Scholar]
- Coles C. A. Yong R. N. Appl. Clay Sci. 2002;22:39–45. [Google Scholar]
- Wang X.-S. Huang J. Hu H.-Q. Wang J. Qin Y. J. Hazard. Mater. 2007;142:468–476. doi: 10.1016/j.jhazmat.2006.08.047. [DOI] [PubMed] [Google Scholar]
- Deng H.-M. Chen Y.-H. Wu H.-H. Liu T. Wang Y.-L. Wu G.-Y. Ye H.-P. Environ. Earth Sci. 2016;75:752. [Google Scholar]
- de Aquino R. V. S. de Lucena P. G. C. Arias S. Landers R. Pacheco J. G. A. Sá da Rocha O. R. Colloids Surf., A. 2024;686:133404. [Google Scholar]
- Jiang N. Xu Y. Dai Y. Luo W. Dai L. J. Hazard. Mater. 2012;215–216:17–24. doi: 10.1016/j.jhazmat.2012.02.026. [DOI] [PubMed] [Google Scholar]
- Fouda-Mbanga B. G. Prabakaran E. Pillay K. Arabian J. Chem. 2020;13:6762–6781. [Google Scholar]
- Surgutskaia N. S. Di Martino A. Zednik J. Ozaltin K. Lovecká L. Bergerová E. D. Kimmer D. Svoboda J. Sedlarik V. Sep. Purif. Technol. 2020;247:116914. [Google Scholar]
- Matter E. A. Hassan A. F. Elfaramawy N. M. Esmail G. Biomass Convers. Biorefin. 2024 doi: 10.1007/s13399-024-05800-1. [DOI] [Google Scholar]
Associated Data
This section collects any data citations, data availability statements, or supplementary materials included in this article.
Supplementary Materials
Data Availability Statement
Data are available upon reasonable request.


