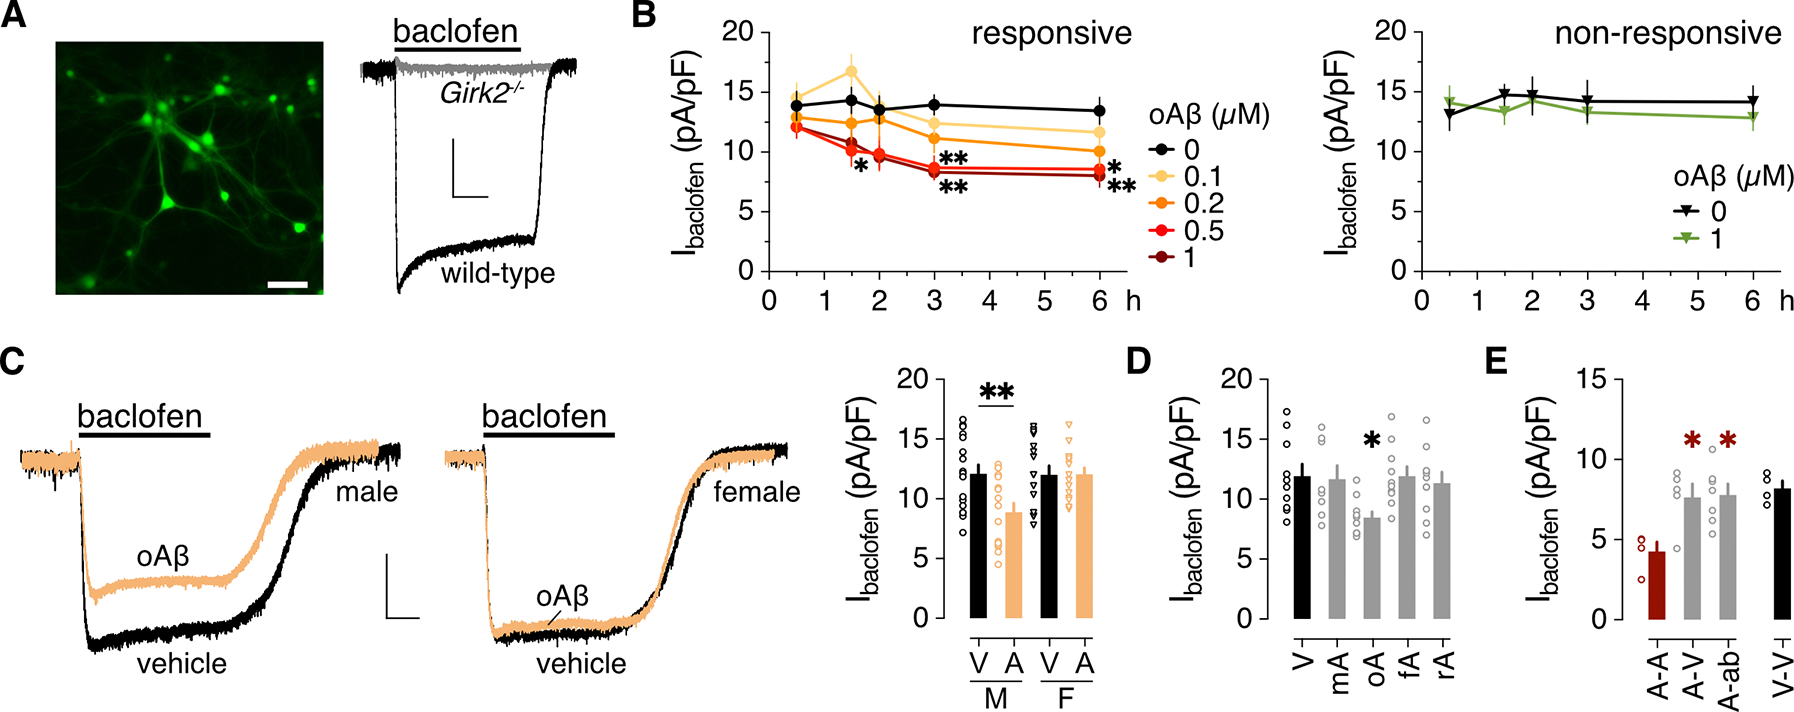
Figure 1. oAβ suppresses GABABR-dependent signaling in male HPC neurons.

(A) Representative image of an HPC culture 4 days after infection with AAV8-CaMKIIα-GFP to highlight excitatory neurons, and representative traces of whole-cell inward currents from GFP-positive wild-type and Girk2−/− neurons following bath application of 100 μM baclofen. Scale bars: 50 μm, left; 500 pA/5 s, right. (B) Impact of oAβ pre-treatment on Ibaclofen density in “responsive” and “non-responsive” HPC cultures, collected from 8 neurons per timepoint and concentration pooled from 5 independent cultures for the responsive group, and 5 (0 μM) or 6 (1 μM) neurons per timepoint pooled from 4 independent cultures for the non-responsive group. Data were analyzed by two-way ANOVA and Dunnett’s multiple comparisons: *P<0.05 and **P<0.01 vs. 0 μM oAβ. (C) Baclofen-induced currents (Ibaclofen) in male and female HPC neurons (scale: 500 pA/5 s), and the summary of Ibaclofen densities for male (M) and female (F) neurons treated with vehicle (V) or oAβ (A: 0.5 μM for 3 h), collected from 17 (M/V), 15 (M/A), 16 (F/V), 15 (F/A) neurons across 4 independent cultures. Data were analyzed by two-way ANOVA and Šídák’s multiple comparisons, **P<0.01. (D) Ibaclofen densities following 3-hour treatment with vehicle (V, 10 cells) or 0.5 μM monomeric Aβ1–42 (mA, 8 neurons), oligomeric Aβ1–42 (oA, 10 neurons), fibrillary Aβ1–42 (fA, 10 neurons), or oligomeric Aβ42–1 (rA, 10 neurons), collected across 3 independent cultures. Data were analyzed by one-way ANOVA and Dunnett’s multiple comparisons, *P<0.05 vs. vehicle. (E) Ibaclofen densities in HPC neurons treated with 0.5 μM oAβ for 6 hours (A), measured 18 hours after replacement with media containing 0.5 μM oAβ (A-A, 4 neurons) or vehicle (A-V, 5 neurons), or anti-Aβ antibody D54D2 (A-ab; 0.16 μg/mL; 7 neurons), collected across 3 independent cultures. Data were analyzed by one-way ANOVA and Dunnett’s multiple comparisons, *P<0.05 vs. A-A. Data from a vehicle-only treatment group (V-V, 4 neurons) are presented on the right for comparison but were not included in the statistical analysis. All data are presented as mean ± SEM.
