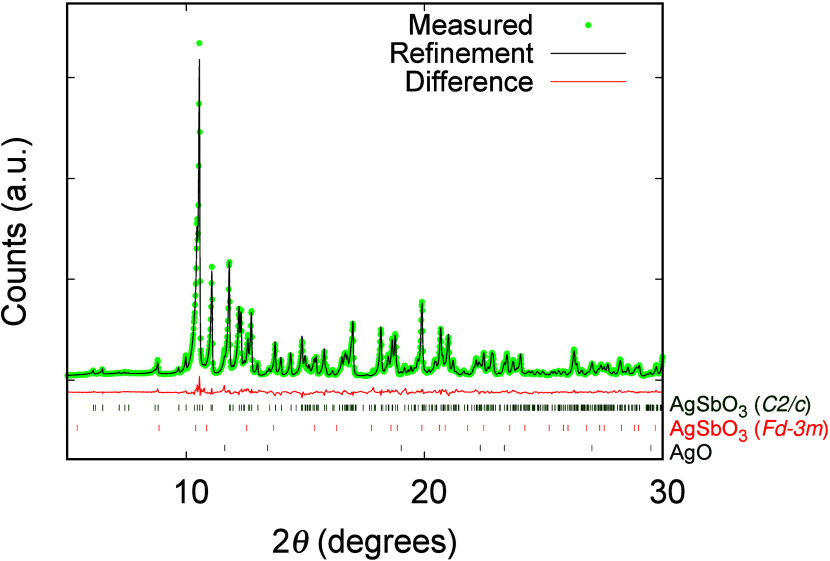
Figure 1.
Scattered
X-ray diffraction intensities of high-pressure monoclinic
AgSbO3 (C2/c symmetry)
[with AgO and AgSbO3 as impurity phases with 0.9 and 0.5 wt
%, respectively] at 298 K under ambient conditions as a function of
2θ. The observed pattern (blue circles) measured in Debye–Scherrer
geometry, the best combined Rietveld fit profiles (red line), and
the difference curves between the observed and calculated profiles
(gray line) are shown. The peak positions of the three phases are
presented as blue lines below. The square root of the intensity is
shown to better visualize the smaller reflections.

