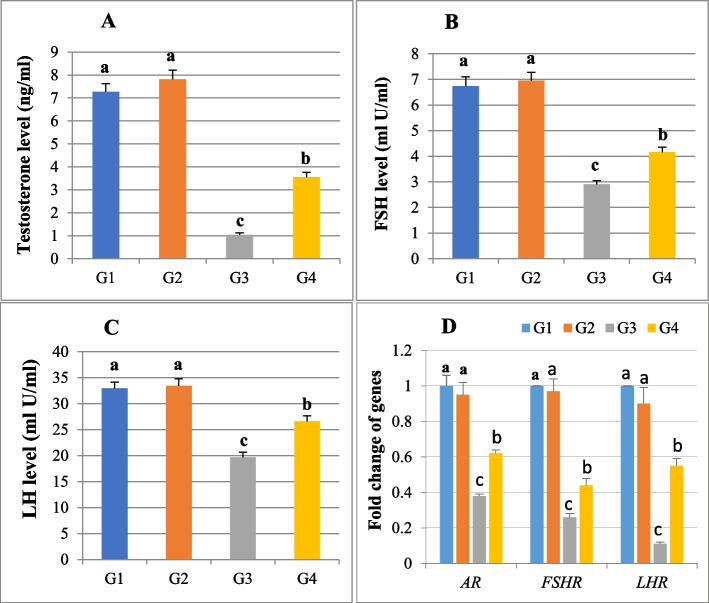
Fig. 4.
A histogram showing serum reproductive hormones levels and means of fold changes of hormone receptor genes in testicular tissue collected from all rats in the four groups. A Testosterone T, (B) Follicle-stimulating hormone FSH, (C) Luteinizing hormone LH, and (D) Follicle-stimulating hormone receptor (FSHR), luteinizing hormone receptor (LHR) and androgen receptor (AR). G1: Control, G2: Anacyclus extract treated group, G3: Cadmium treated group, G4: Cadmium and extract treated group. Data is presented as mean ± standard error (S.E.). Different letters represent significant differences (P ≤ 0.05) between experimental groups

