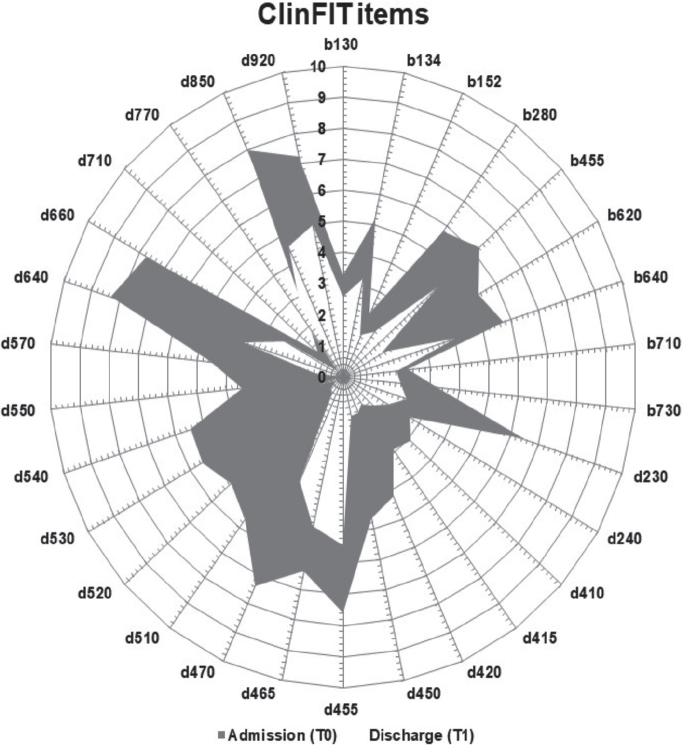
Fig. 4.
Composite radar chart illustrating the median scores for each ClinFIT item on admission (T0), and on discharge (T1)*. *The composite radar chart provides a graphic representation of the functional profile from the ClinFIT data. The 30-scale items are arranged as spokes of a wheel (codes outside the circumference), with ICF qualifiers from 0 = no problem to 10 = complete problem, running from the centre outwards. Dark-shaded area represents the median admission (T0) scores, and light-shaded area represents the median discharge (T1) scores. b130–b730 represent 9 ClinFIT “Body function” categories and d230–d920 represents 21 ClinFIT “activity and participation” categories.

