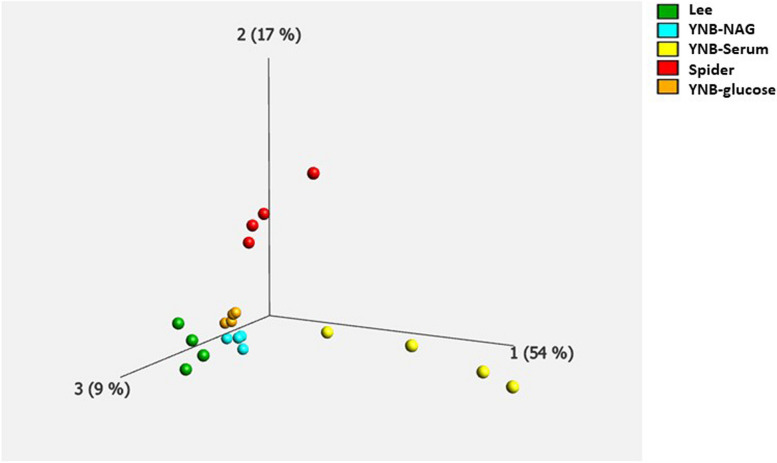
Fig. 2.
Principal component analysis (PCA) on the levels of 1454 proteins differentially expressed between media. The significance of the observed differences was determined with a q-value threshold of 0.01 (values below this threshold indicate that the differences are statistically significant at a high level of confidence). The PCA revealed five distinct protein groups, each representing a different set of experimental conditions: yeast nitrogen base (YNB-glucose) in orange, YNB-Serum in yellow, Lee medium in green, YNB-NAG in blue, and Spider medium in red. The percentage of the variance associated with each principal component is indicated on the axis legend

