Fig. 1.
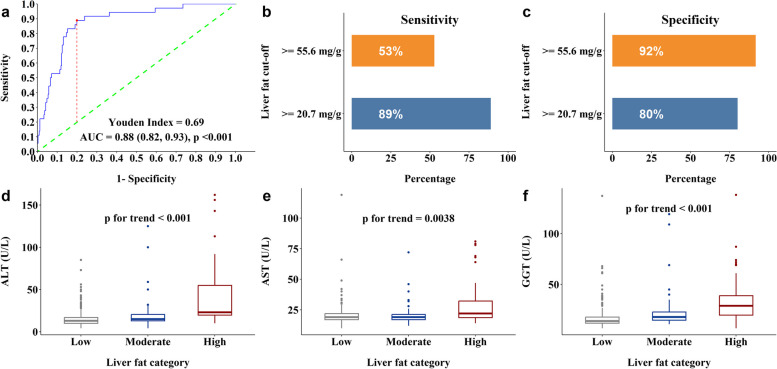
Box plots of metabolic-risk-based liver fat cutoff and liver enzymes across the different liver fat categories. a Receiver operator curve analysis for predicting MetS with continuous liver fat levels as the sole predictor, 95% CI indicated in brackets (n = 372). b Sensitivity of proposed vs conventional liver fat cutoffs. c Specificity of proposed vs conventional liver fat cutoffs. d ALT (U/L) (n = 373), e AST (U/L) (n = 373), f GGT (U/L) (n = 373). p for trend values represents trend of each liver enzyme with increasing liver fat

