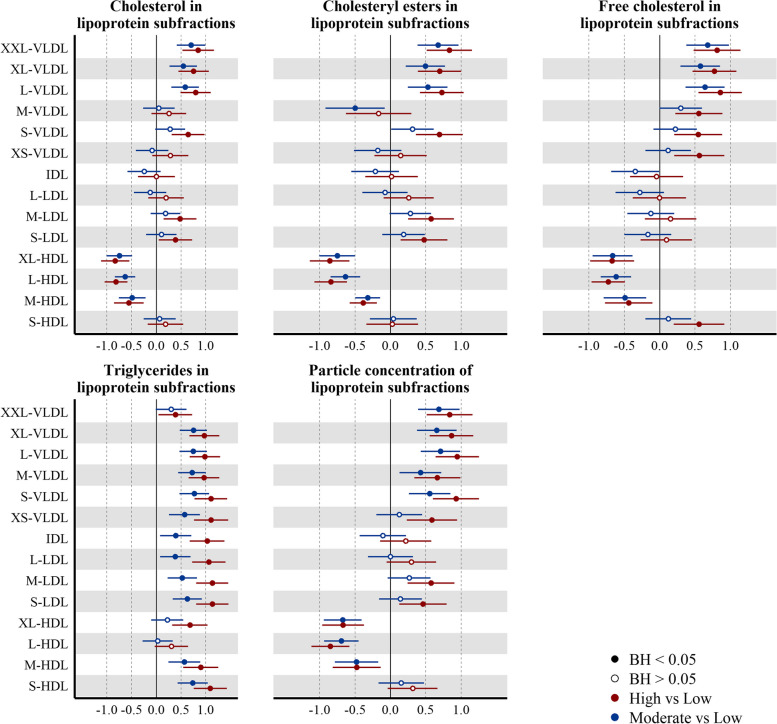
Fig. 5.
Associations between the liver fat accumulation and plasma lipoprotein composition and concentration. Point estimates represent the beta coefficients for 1-SD change (95% CI) (n = 372) in the log10 transformed NMR-metabolite in the liver fat category, with respect to Low liver fat category (liver fat < 2.07%). Model adjusted for ethnicity, age, parity, education level, and BMI at pre-conception. Hollow/filled circles were/were not statistically significant with BH-adj p-values < 0.05, as determined by the Benjamini-Hochberg (BH) method

