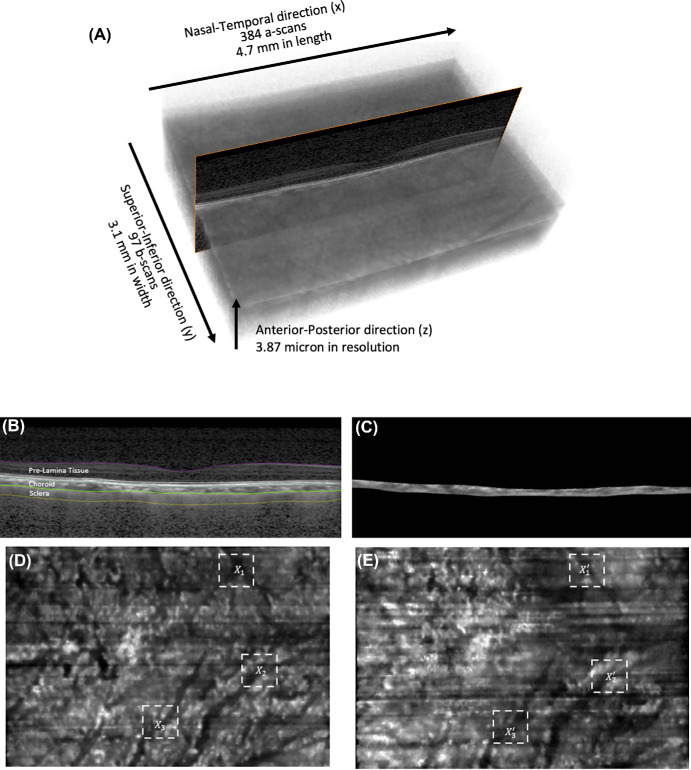
Figure 1.
(A) OCT scans of the macula region with coordinates definition and dimension. (B) Segmentation of prelamina tissue, choroid, and sclera from a single B-scan. (C) Extraction of choroid tissue from B-scans. (D) Projected choroidal image of baseline volume, showing blood vessels in black. (E) Projected choroidal image of IOP-elevated volume, showing blood vessels in black. Xn is the bifurcation that corresponds with X′n for each eye.

