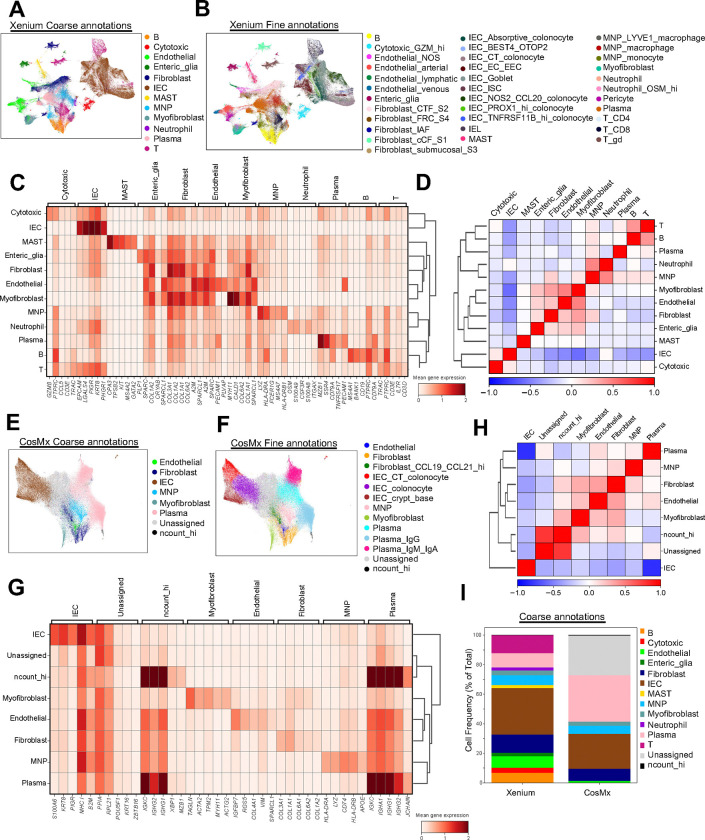
Fig. 2|. Cell type recovery across spatial transcriptomics platforms.
(A,B) UMAP visualization of Xenium dataset (313,940 cells), colored by coarse (A) and fine (B) annotations. (C) Heatmap displaying gene expression of the top 5 landmark genes for each coarse annotation cell type within the Xenium dataset. (D) Correlation matrix displaying the correlation between coarse annotation cell types identified for Xenium. (E,F) UMAP visualization of CosMx dataset (126,368 cells), colored by coarse (E) and fine (F) annotations. (G) Heatmap displaying gene expression of the top 5 landmark genes for each coarse annotation cell type within the CosMx dataset. (H) Correlation matrix displaying the correlation between coarse annotation cell types identified for CosMx. (I) Stacked bar plots for coarse annotation displaying cell frequency (percent of total) for Xenium and CosMx.

