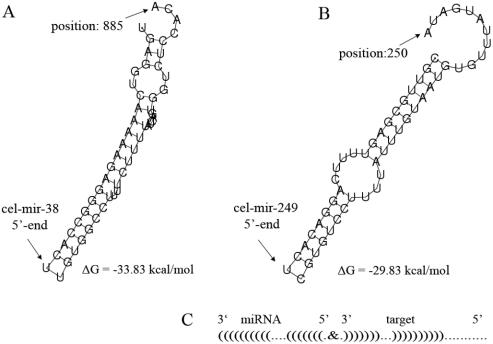
Figure 4.
Representation of pair-wise interaction between miRNA and mRNA target. Examples of secondary structure graphics that can be displayed when the link of the right column in the result table (see Figure 3) is activated. (A) This specific example displays the predicted interaction of miR-38 with lin-41 (top result in table of Figure 3), which shows that the interaction of the miRNA and the target mRNA is restricted to the 5′ side of the miRNA; at the 3′ side the interaction is rather weak. Despite the low ΔG value, this interaction might not be functional. (B) The interaction of miR-249 with lin-41 is symmetrical and more likely to be relevant. (C) The same interaction as in (B) in a schematic representation; this simplified illustration of an RNA–RNA interaction is used in the downloadable results file ‘Results in .CSV format’ (see Figure 3).

