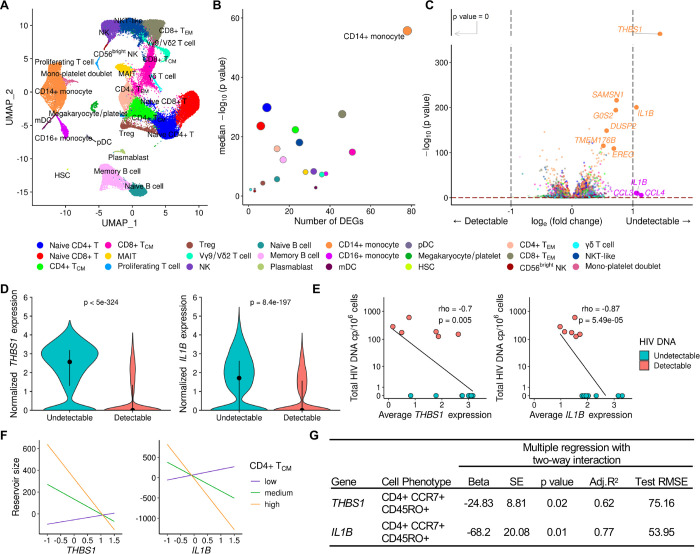
Figure 2. Differentially expressed genes in monocytes associate with HIV reservoir size during ART.
A) scRNA-seq identified 24 unique clusters of immune cell subsets. B) CD14+ classical monocytes have the highest number of DEG between the detectable and undetectable reservoir groups. Circle color represents cell subset while circle size indicates corresponding cell number. C) Volcano plot shows DEG in all cell types with p values that are significant after correction, as indicated above the horizontal dotted line. Labeled genes have a p<10e-6 and absolute average loge fold change ≥1 (vertical dotted lines) or p<10e-100 and absolute average loge fold change ≥0.5. D) The most significant DEG in CD14+ monocytes comparing reservoir groups. Black dots represent the median normalized gene expression values (loge), and lines represent the interquartile ranges. Teal: undetectable reservoir, red: detectable reservoir. Significance was determined by the Mann-Whitney U test with Bonferroni correction (n=14). E) Participant-specific categorical analyses of the most significant DEGs. Normalized gene expression within CD14+ monocytes was averaged per participant and correlation was determined by the Spearman test (n=14). F-G) Interaction plots of multiple regression between THBS1 or IL1B expression in monocytes and reservoir size with varying frequency of the CD4+ TCM population. Nominal p values are indicated for the interaction analyses.

