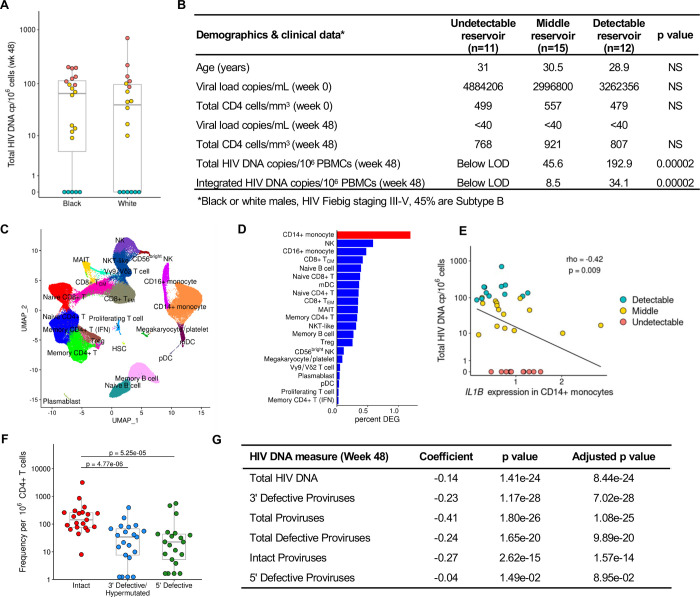
Figure 3. Validation of IL1B association with smaller reservoir size from an independent cohort with a different infecting viral subtype across various Fiebig stages.
A) HIV DNA levels vary within the A5354 subtype B cohort from the USA (n=38). The participant samples used in this study are highlighted based on reservoir size: red=detectable; teal=undetectable and yellow=middle. Black and White indicate differences in ancestry of the participants. B) Characteristics of participants comprising the detectable, middle, and undetectable reservoir size categories (mean values are shown) and p values comparing the extreme phenotype groups. HIV-1 subtype information was only available for a subset of the participants. NS: not significant C) Dimensionality reduction plot of the different immune clusters in this cohort. D) CD14+ monocytes have the highest number of normalized DEG associated with reservoir size using a continuous analysis including all 38 participants. E) IL1B participant-specific average gene expression in CD14+ monocytes categorized by total HIV DNA (n=38). Spearman correlation p value and rho are shown. F) IPDA® measurements from a subset of the participants in this cohort (n=21). G) IL1B association with different reservoir type measurements (rows) from the participants with IPDA measurements (n=21).

