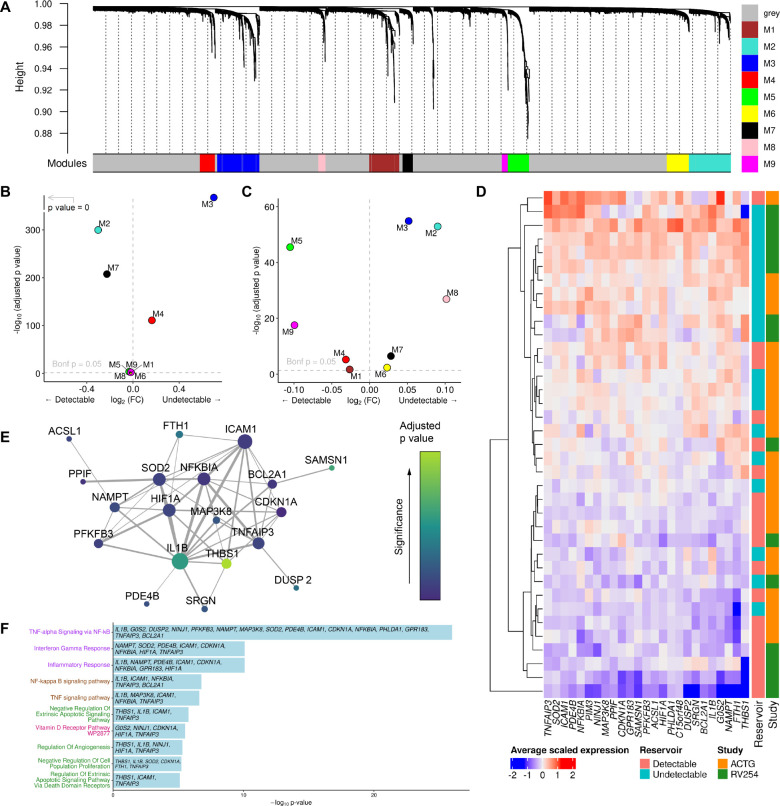
Figure 4. Pathway analyses identifies a distinct signature associating with reservoir size.
A) Gene co-expression modules in CD14+ monocytes from the RV254 Thai study. B) IL1B is in the M3 WGCNA module which was enriched in cells from RV254 participants with undetectable reservoir based on the top 25 hub genes in the module (detectable=6, undetectable=8). C) Using the same module hub genes found in RV254, the M3 module was also enriched in cells from the undetectable reservoir participants in the A5354 cohort when HIV DNA levels were grouped categorically (detectable=12, undetectable=11). D) Average expression of the 25 top hub genes from the M3 module had generally higher expression in participants with undetectable reservoir in both cohorts. E) Predicted protein interaction network of top 25 hub genes using the STRING protein database. Larger nodes have higher degree of connectivity; node color indicates significance in the categorical DEG comparison between the detectable and undetectable groups in RV254 CD14+ monocytes. F) Gene ontology analyses of genes enriched in module M3 in CD14+ monocytes.

