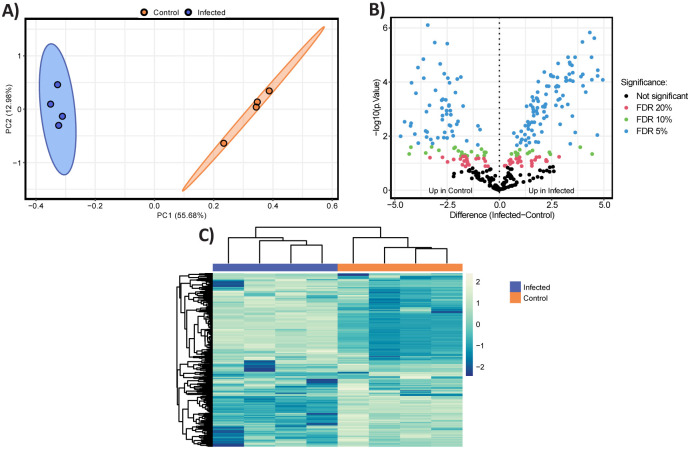
Fig. 3. Differential proteomics profile in the supernatant obtained during the mid-log phase on the fifth day of the co-culture experiment with B. thetaiotaomicron Δcps and DAC15.
(A) Principal Component Analysis (PCA) of proteomic profiles of B. thetaiotaomicron Δcps supernatant between control (orange) and DAC15-infected samples (blue colour). Ellipses represent 95% confidence intervals, and the explained variances of the two principal components are shown in brackets along the axes. (B) Volcano plot representing the significantly differentially abundant proteins. Non-adjusted p-values are plotted; however, points are coloured for significance based on corrected p-values. Proteins upregulated in control (left panel) and DAC-15 infected (right panel) are plotted based on fold change and statistical significance (Benjamini-Hochberg FDR correction) at different thresholds: 5% (blue), 10% (green), 20% (red), and non-significant (black). (C) Heatmap displaying hierarchical clustering of proteomic data generated from z-scored data. Row and columns are clustered based on Euclidean distance, showing differential protein expression between control and infected conditions. Columns are coloured by sample condition with blue representing infected samples and orange representing control. Yellow indicates higher relative protein abundances, while blue represents lower relative abundance.

