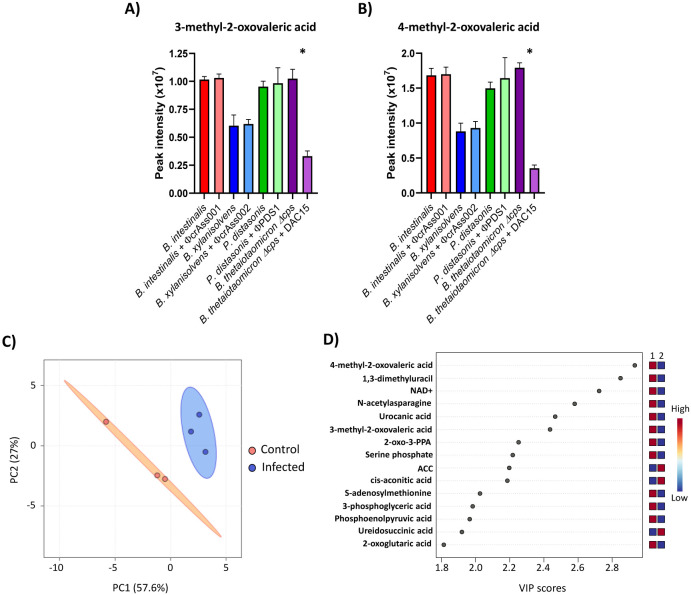
Fig. 4. Intracellular metabolomic changes in B. thetaiotaomicron Δcps after DAC15 infection.
(A-B) LC-MS peak intensities of 3-methyl-2-oxovaleric acid (A) and 4-methyl-2-oxovaleric acid (B) for each phage-host pair, obtained from untargeted intracellular metabolomics analysis performed in the samples obtained during mid-log phase growth on the fifth day of the co-culture experiment. Bars represent the mean of triplicate biological samples, with error bars indicating the standard deviation (SD). * Significant differences were set up at p < 0.05. (C) Principal Component Analysis (PCA) of intracellular metabolomic profiles from B. thetaiotaomicron Δcps and DAC15 co-cultures, based on detected compounds with accuracy levels 1 and 2a, extracted from bacterial pellets. Orange indicates the control condition (uninfected), while blue is the infected condition. Ellipses represent 95% confidence intervals, and the explained variances of the two principal components are shown in brackets along the axes. (D) Important features identified by partial least squares-discriminant analysis (PLS-DA) in B. thetaiotaomicron Δcps bacterial pellets collected at the mid-log phase on the fifth day of the co-culture. The coloured boxes on the right indicate the relative peak area of each corresponding metabolite in the groups under study, with red indicating higher peak areas and blue indicating lower. Group 1 corresponds to the control condition, and group 2 corresponds to the DAC-15 infected samples. 2-oxo-3-PPA: 2-oxo-3-phenylpropanoic acid; ACC: 1-Aminocyclopropanecarboxylic acid.

