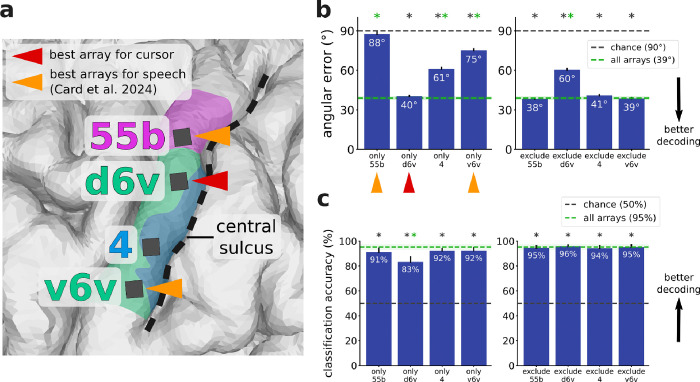
Figure 3. The dorsal 6v array contributed the most to cursor velocity decoding.
a. Zoomed-in view of T15’s array locations shown in Fig. 1b. Triangles indicate arrays providing the best decoding performance for speech (orange) and for cursor control (crimson). The best speech arrays were identified in Card et al. 2024. b. Offline analysis of cursor decoders trained using neural features from each array alone (left) and with each array excluded (right), evaluated according to average angular error between the vector toward the target and the vector predicted by the decoder. The decoder trained on d6v alone performed almost the same as the decoder trained on all arrays. Error bars and the green shaded region indicate 95% CI. Stars indicate significant difference from chance performance (gray star, p<0.01, one-sample t-test, Bonferroni correction) or from performance using all arrays (green star, p<0.01, two-sample t-test, Bonferroni correction). c. Offline classification of click vs. non-click time windows using neural features from each array alone (left) and with each array excluded (right), evaluated with classification accuracy. Each of the four array locations contained click information. Error bars and the green shaded region indicate 95% CI. Stars indicate significant difference from chance performance (gray star, p<0.01, one-sample t-test, Bonferroni correction) or from performance using all arrays (green star, p<0.01, two-sample t-test, Bonferroni correction). Per-electrode contribution maps for cursor and click are shown in Supp. Fig. 2.

