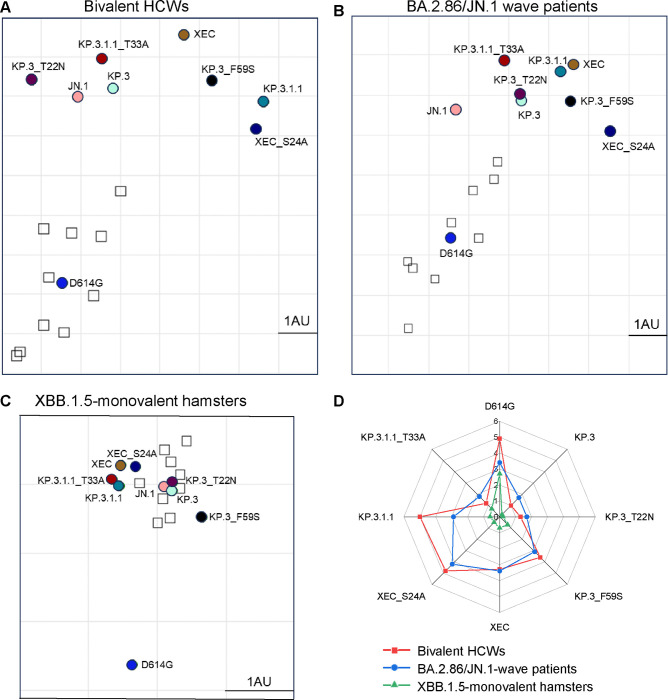
Figure 3: Analysis of antigenicity of XEC and related variants.
(A-C) Antigenic cartography analysis was conducted for the nAb titers results for the bivalent vaccinated HCWs (A), the BA.2.86/JN.1 wave infected patients (B), and the XBB.1.5-monovalent vaccinated hamsters (C). One antigenic distance unit (AU) (AU = 1) represents an approximate two-fold change in NT50. Circles represent the different spike antigens while boxes represent individual sera samples. (D) The antigenic distances of each variant relative to JN.1 from three groups of cohorts (n=3) were averaged and plotted. The scale bar represents 1 antigenic distance unit (AU).

