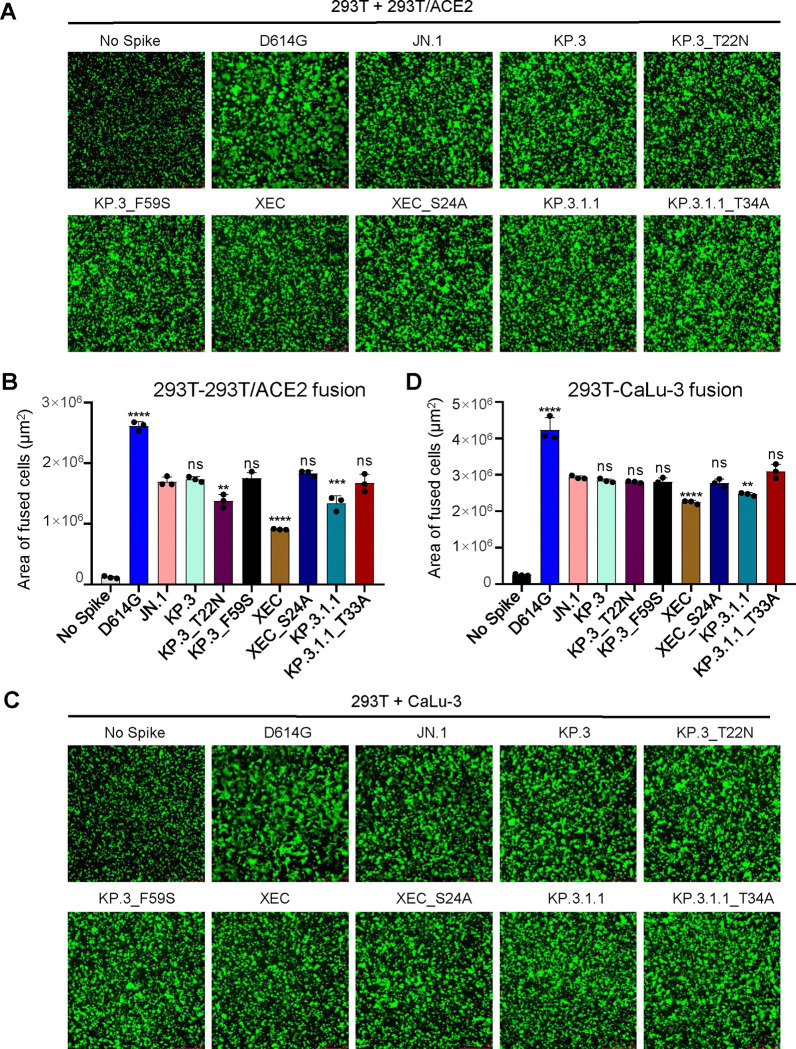
Figure 4: XEC exhibits decreased fusogenicity in HEK293T-ACE2 and CaLu-3 cells.
Fusion of spikes was determined in HEK293T-ACE2 cells (A-B) and CaLu-3 cells (C-D). Representative images of fusion are depicted for 293T-ACE2 (A) and CaLu-3 (C), and quantification of total areas of fusion across 3 images are represented for in (B) 293T-ACE2 and (D) CaLu-3 cells. Areas of fused cells were determined using microscope software (see Methods). Plots represent means with standard deviation with significance determined in comparison to JN.1. Significance was calculated using repeated measures one-way ANOVA and represented as ns p > 0.05, **p < 0.01, ****p < 0.0001.

