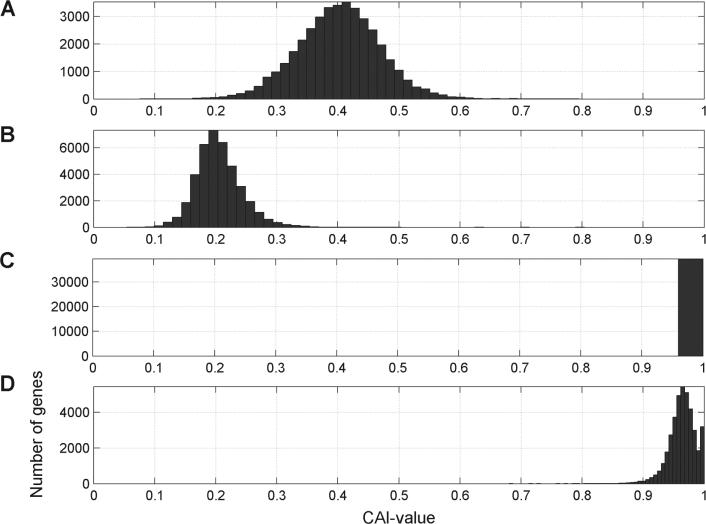
Figure 2.
Distribution of CAI values of the C.elegans genome under different conditions. (A) Calculation of the CAI applying the relative adaptiveness of C.elegans. (B) Calculation of the CAI applying the relative adaptiveness of E.coli. (C) Distribution of CAI values of the genes from C.elegans after adaptation to the codon usage of E.coli. The CAI was calculated applying the relative adaptiveness of E.coli. (D) Same as shown in (C); however, restriction endonucleases cleavage sites for ApaI, AccI, BamHI, BstXI, ClaI, DraII, EcoO109I, EcoRV, EcoRI, EagI, HincII, HindIII, KpnI, NotI, PstI, SalI, SmaI, SpeI, SacII, SacI, XhoI and XbaI were eliminated, resulting in a decrease of the CAI.

