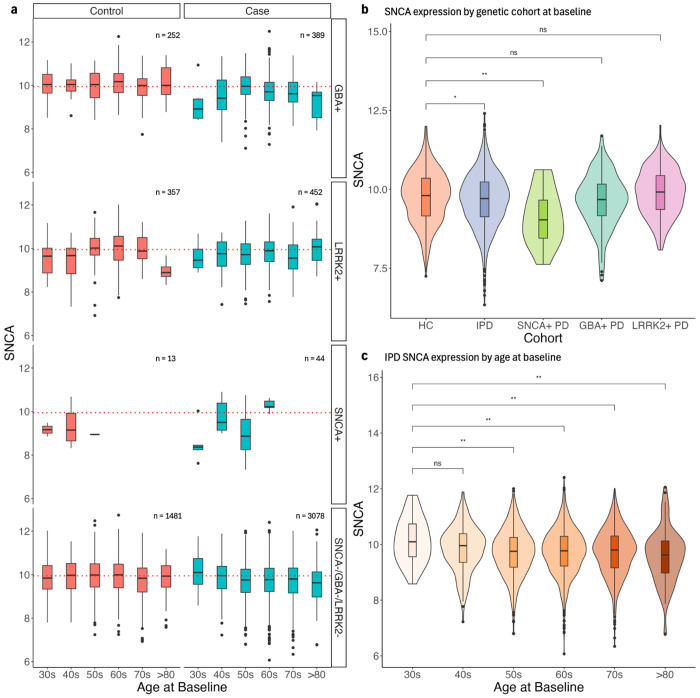
Fig. 6 |. SNCA expression stratified by demographic, clinical, and biological factors.
a, b, c, Gene counts were log(CPM) normalized and corrected for predicted neutrophil percentage. a, SNCA expression in samples stratified by genetic status and diagnosis. The red dotted line represents the median SNCA expression in healthy control samples (i.e. ‘Control’ and ‘SNCA−/GBA−/LRRK2−). b, SNCA expression of HC, IPD, SNCA+ case samples, GBA+ case samples, and LRRK2+ case samples at baseline only. c, SNCA expression of IPD samples over age at baseline. All p-values were calculated using a Wilcoxon rank-sum test.

