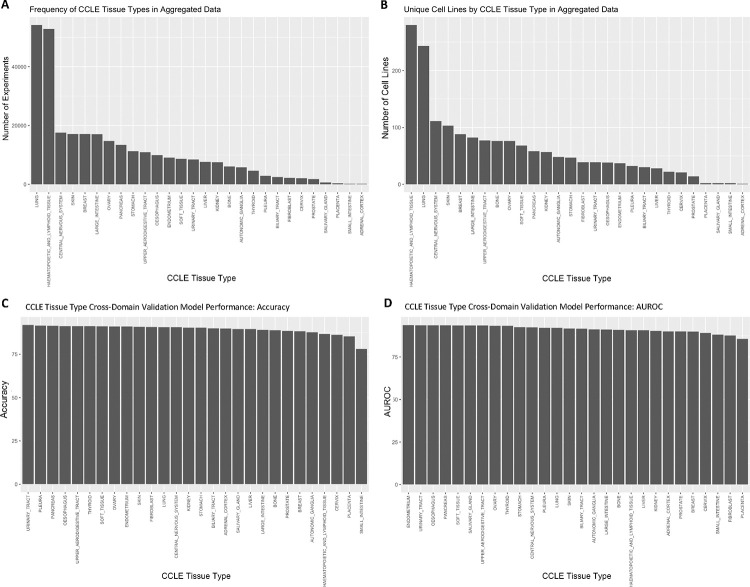
Figure 4. Number of drug sensitivity data points by CCLE Cell Line Tissue Types in aggregated training data vs. prediction performance by tissue type.
(A) The frequency of experiments for CCLE tissue type is shown for cell lines in the initial drug sensitivity aggregated training dataset. Number of experiments refers to the number of unique drug-cell line combinations with a DSS3 score recorded and applied as a training label. (B) The frequency of cell lines corresponding to each CCLE tissue type is shown for cell lines in the initial drug sensitivity aggregated training dataset. (C) The cross-domain validation accuracy for cell lines grouped by tissue type is shown for each category. The prediction accuracy was high (>78%) across all cell line tissue types despite the range in representation across the training sets. (D) The cross-domain validation AUROC for cell lines grouped by tissue type is shown. Like accuracy, the prediction AUROC was also high (>80%) across all cell line tissue types.

