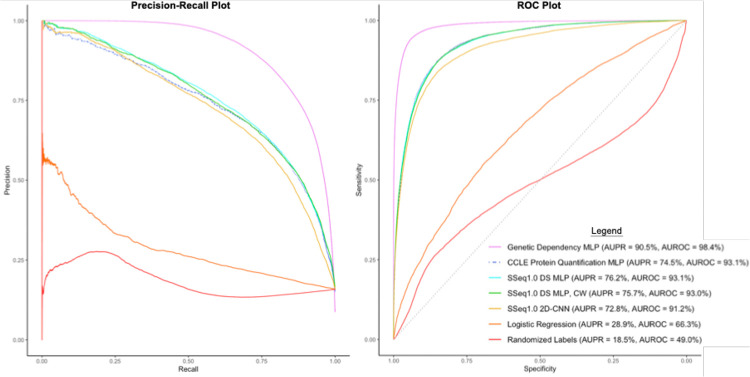
Figure 6. Precision-Recall curve and ROC curve plots for seven machine learning models evaluated.
The legend shown applies to both plots and specifies the area under the precision-recall curve (AUPR) and the area under the ROC curve (AUROC) for each model. The Genetic Dependency MLP model displayed the highest performance according to these metrics, with an AUPR of 86.5% and an AUROC of 95.9%, indicating reliable prediction performance. The measured AUPR for the SSeq1.0 drug sensitivity (DS) MLP model was 76.2% and the measured AUROC was 93.1%, while the SSeq1.0 MLP with class weight optimization (SSeq1.0 DS MLP, CW) performed similarly with an AUPR of 75.7% and AUROC of 93.0%. All DNN models displayed higher measured AUC values than both the MLP model trained with Randomized Labels, and the basic Logistic Regression model.

