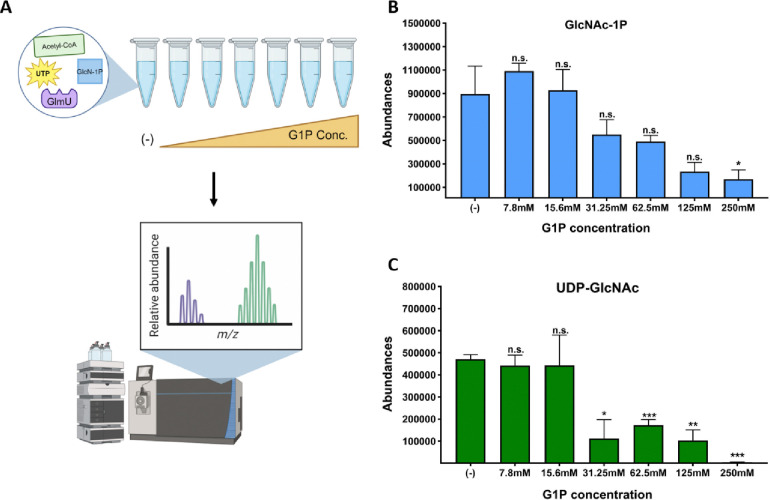
Figure 5: Glucose-1P inhibits GlmU biochemical reaction in a concentration dependent manner.
A) Schematic portraying the in vitro biochemistry experimental design. Biochemical reaction components, UTP, Acetyl-CoA, GlcN-1P and GlmU, mixed with buffer, were added to test tubes. After incubation, the reaction was stopped and ran on the LC-MS machine. Abundance peaks were measured for the stated molecules. B) Peak values for GlcNAc-1P product from reactions with increasing glucose-1P concentrations. SEM plotted with 3 replicates. * = p < 0.05 (unpaired t-tests). C) Peak values for UDP-GlcNAc product from reactions with increasing glucose-1P concentrations (in mM, X-axis). Averages and SEM plotted from 3 replicates. * = p < 0.02, ** = p < 0.002, *** = p < 0.0005 (unpaired t-test).

