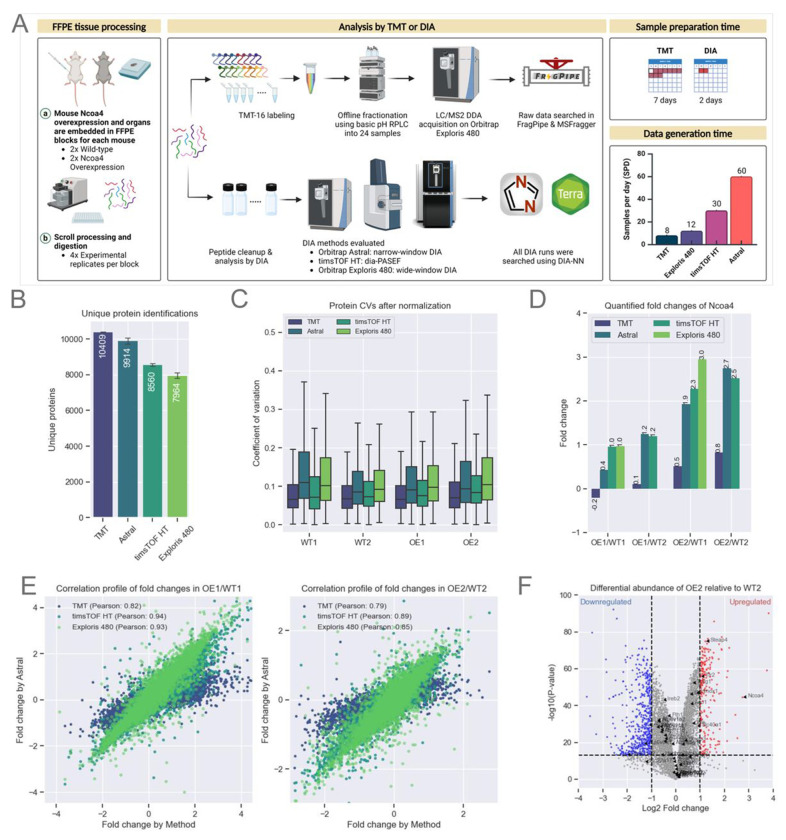
Figure 3: Evaluation of Quantitative Accuracy Using Multiple Instrument Platforms.
A. Schematic representation of mouse Ncoa4 WT and OE FFPE blocks. Peptides were either TMT-labeled or analyzed label-free using various DIA methods and instruments, as highlighted in the figure. TMT data was searched using FragPipe while all DIA analysis were performed using DIA-NN as that supported both Thermo and Bruker raw files.
B. Protein identifications for each experiment (n=16 per experiment). Bars represent the average, with error bars indicating the standard deviation.
C. Normalized protein abundance CVs from experimental replicates (n=4 per sample). The box represents the interquartile range (IQR), with the top and bottom edges indicating the 75th and 25th percentiles, respectively. The line within the box denotes the median, and whiskers extend to include data within 1.5x the IQR.
E. Quantified Ncoa4 fold-change between WT and OE mouse models across each TMT and DIA method (X-axis) compared to DIA on Astral (Y-axis). Scatter plots show protein fold-change for two WT and OE pairs, labeled WT1, WT2, OE1, and OE2.
F. Volcano plot illustrating differential protein abundance between WT2 and OE2.

