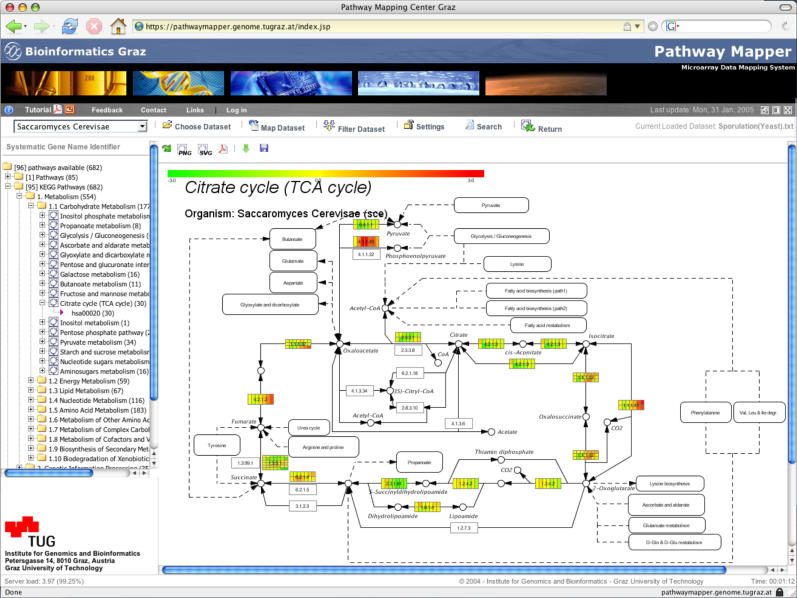
Figure 1.
PathwayExplorer example: a screenshot of a pathway mapped with expression data. (i) The toolbar frame (the row including the organism field) offers various setup and visualization options. (ii) Hierarchical tree frame (on the left) enables browsing through all available pathway sections. (iii) The main frame (in the center) displays the citrate cycle pathway extracted from KEGG, which mapped with a yeast sporulation data set with seven different time points (0, 0.5, 2, 5, 7, 8 and 11.5 h). The color-coded boxes represent mapped genes. If more than just one gene ID (e.g. RefSeq) matches to a box, each box is split up into several horizontal elements. According to the number of experiments/time points (in this case seven time points), the boxes are split again into vertical columns which display the expression level of each time point. To visualize a mapped expression profile in a different way, one has to choose the corresponding horizontal row of a box (see Figure 2).

