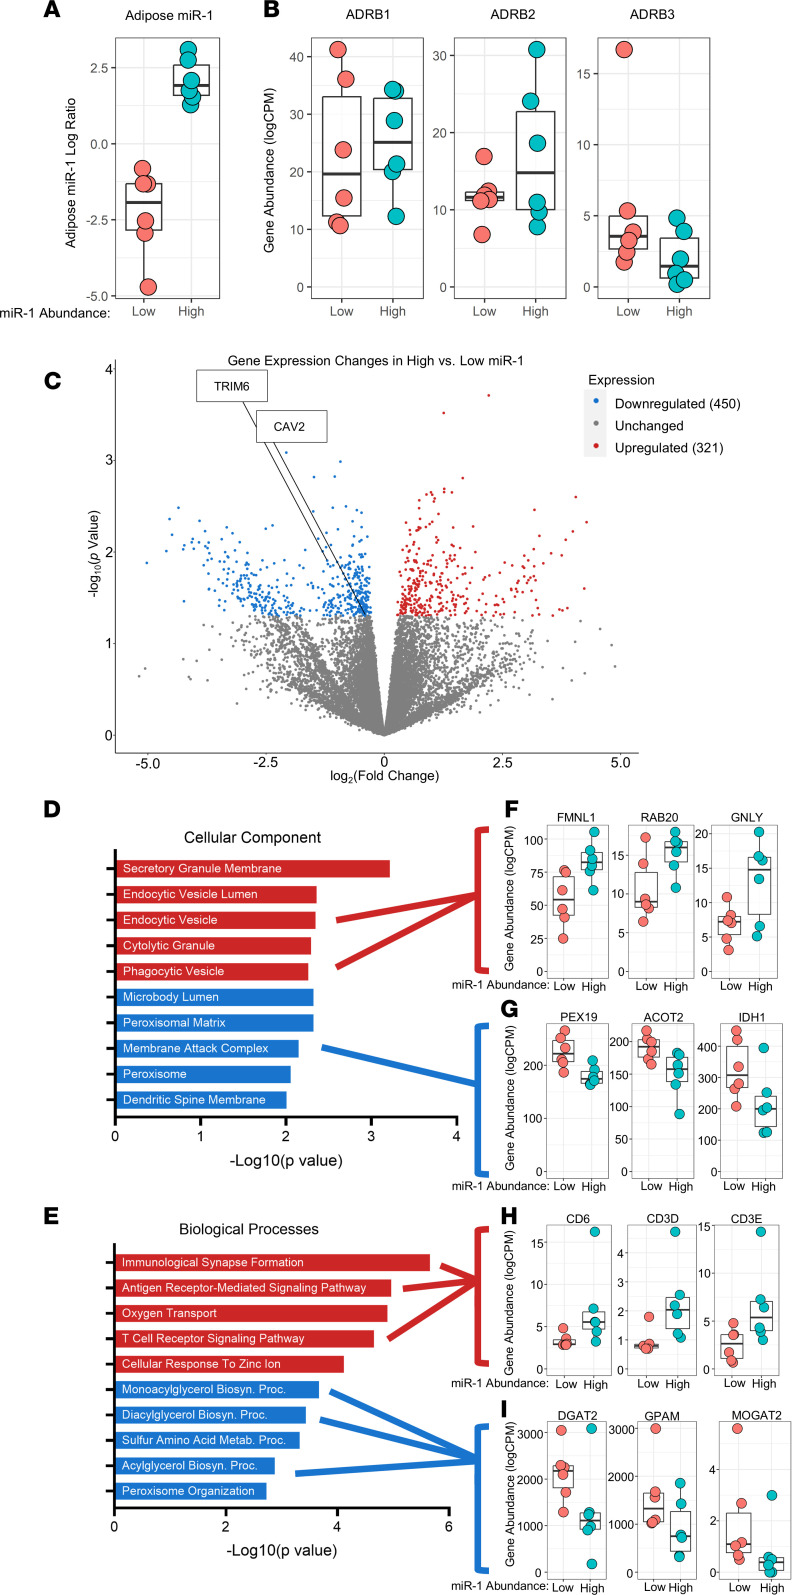
Figure 3. RNA-Seq analyses reveal elevated EV uptake pathways in participants with high adipose miR-1 in response to exercise and identifies potential miR-1 target genes.
Expression of (A) miR-1, (B) β-adrenergic receptor 1 (ADR-β1), ADR-β2, and ADR-β3 in adipose tissue in participants with high (n = 6) versus low (n = 6) changes in miR-1. (C) Comparison of gene expression between high and low miR-1 responders. Gene enrichment analyses for upregulated and downregulated genes (D and E) with differences in expression levels between high and low miR-1 responders for selected genes (F–I). Data are expressed with box plots (Data are expressed with box plots displaying the 90th and 10th percentiles at the whiskers). FMNL, formin-like 1; GNLY, granulysin; PEX19, peroxisomal biogenesis factor 19; ACOT2, acyl-CoA thioesterase 2; IDH1, isocitrate dehydrogenase 1; DGAT2, diacylglycerol O-acyltransferase 2; GPAM, glycerol-3-phosphate acyltransferase; MOGAT2, monoacylglycerol O-acyltransferase 2.

