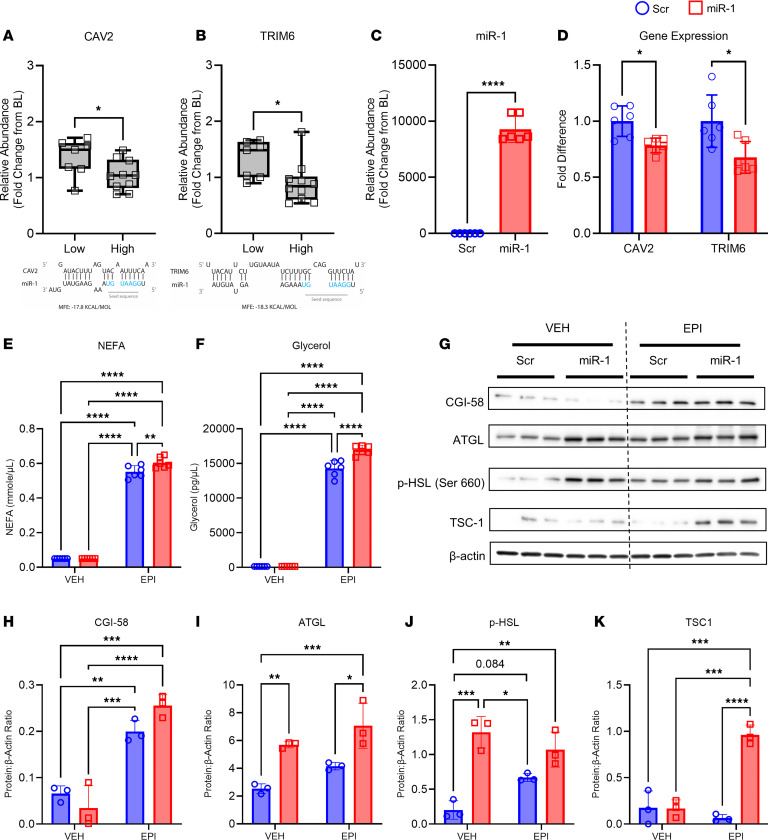
Figure 4. miR-1 targets CAV2 and TRIM6 mRNAs to enhance catecholamine-induced lipolysis.
Differences in (A) caveolin 2 (CAV2) and (B) tripartite motif-containing protein 6 (TRIM6) expression between participants with high (n = 10) versus low (n = 7) changes in adipose miR-1 in response to exercise, as well as seed sequence schematic depicting the miR-1 binding affinity for these mRNAs. (C) Efficiency of miR-1 transfection as depicted by fold change in miR-1 relative to scrambled control (Scr). (D) Changes in CAV2 and TRIM6 expression with miR-1 transfection. The abundance of (E) Nonesterified fatty acids (NEFAs) and (F) glycerol in the media of scrambled control (Scr) and miR-1–transfected human adipose-derived stem cells (ADSCs) treated with vehicle (VEH) or epinephrine (EPI). (G) Protein abundance of (H) comparative gene identification-58 (CGI-58), (I) adipose triglyceride lipase (ATGL), (J) phosphorylated hormone-sensitive lipase (p-HSL), and (K) tuberous sclerosis protein 1 (TSC1) in Scr and miR-1–transfected ADSCs treated with VEH or EPI normalized to β-actin. Data are expressed as mean ± SD. Unpaired, 1-tailed Mann-Whitney tests were used to compare differences in CAV2 and TRIM6 expression in panel A and B. 1-tailed Welch’s unpaired t tests with Holm-Šidák’s corrections for multiple comparisons as needed were used to compare gene expression in panels C and D. 2-way ANOVAs with Tukey’s corrections for multiple comparisons were used to compare glycerol, NEFA, and protein levels in panels E, F, and H–K. *P < 0.05; **P < 0.01; ***P < 0.001.

