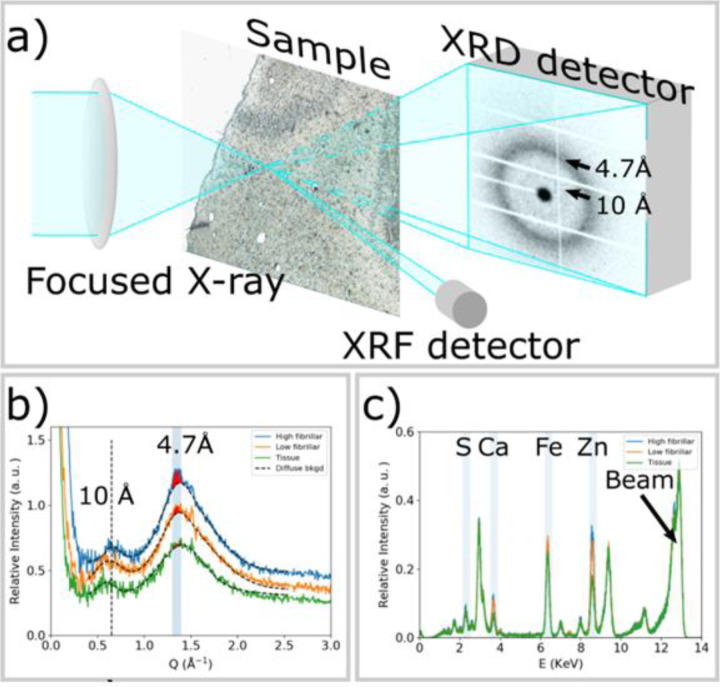
Figure 1.
a) Experimental scheme for collecting µXRD and µXRF data simultaneously. The X-ray beam is focused to 2.5 μm by the lens and the sample is raster scanned with step size of 2.5 μm. µXRD from tau lesions gives rise to a prototypical cross-β fiber diffraction pattern, which is dominated by reflections at scattering angles corresponding to periodicities of 10 Å and 4.7 Å. An XRF detector is placed nearly perpendicular to the sample to simultaneously collect XRF signal. b) Azimuthally averaged scattering patterns from a tau lesion with significant high-fibrillar tau (blue); a tau-containing lesion containing low-fibrillar tau (orange) and a region of tissue exhibiting no tau pathology (green). High-fibrillar tau gives rise to a pronounced 4.7 Å peak, the intensity of which can be estimated by subtracting a smooth background and integrating the remaining intensity (red fill). Short fibrils, or tau aggregates that are low-fibrillar may give rise to a weak peak at 4.7 Å spacing that can also be estimated through subtraction of a smooth background. Surrounding tissue also gives rise to broad scattering peaks at ~ 10 Å and 4.7 Å spacing, but lacks the additional pronounced features at 4.7 Å. c) μXRF spectra from a tau lesion with significant high-fibrillar tau (blue); a tau-containing lesion with little or low-fibrillar tau (orange) and a region of tissue exhibiting no tau pathology (green). The spectral line exhibits patterns of chemical elements, including sulfur (S) with Kα edge at 2.31 KeV, calcium (Ca) at 3.64 KeV, iron (Fe) at 6.4 KeV and zinc (Zn) at 8.64 KeV. The peak at 13 KeV arises from Rayleigh and Compton scattering of the incident X-ray beam. The maps of elemental distributions are calculated by integrating the spectrum over a range of ± 0.1KeV around the corresponding Kα energy for each pixel. Intensity of peaks in the XRF spectrum reveal a relative degree of deposition of each element within the tissue sample.

