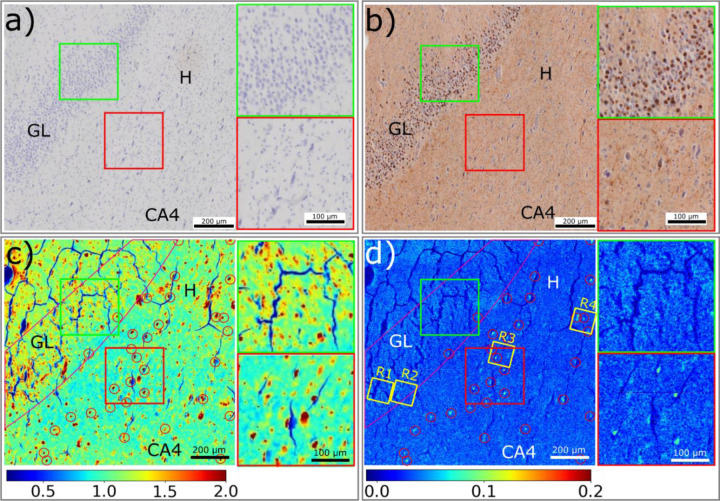
Figure 2.
µXRD analysis of a region of a Dentate Gyrus including the Granular Layer (GL), Hilus (H) and the Cornu Ammonis region 4 (CA4) of the hippocampus. a) Image of a serial section stained for Aβ corresponding to the region of the unstained section scanned by XRD. Different cell morphologies, including granule cell and pyramidal cell, are present. b) Image of a serial section stained for tau. The granular layer is dominated by Pick bodies, while tau lesions from dystrophic neurites and pyramidal cells are distributed across the hilus region. Two inserts show the distribution of tau lesions in granular layer (green box) and hilus region (red box). c) The distribution of macromolecular density is calculated by integrating the small-angle X-ray scattering intensity within the range of 0.05 – 0.25 Å−1 of Q. The distribution of macromolecular density exhibits dense features in both the granular layer, CA4 and hilus and includes features that are low in fibrillar content and those that exhibit a high concentration of fibrillar tau (indicated by red circles). d) The distribution of fibrillar tau is determined by the integral intensity of patterns after diffuse background subtraction. Regions containing oligomeric or low fibrillar aggregates appear as light blue; high fibrillar lesions as bright blue (marked by red circles). Two inserts on the right show the distribution of aggregates in the Granular layer (green box) and fibrils in the Hilus region (red box). R1-R4 are four ROIs in which high resolution XRF images were collected as detailed in Figure 5. The relative intensity of color scale for c) and d) is given in arbitrary units.

