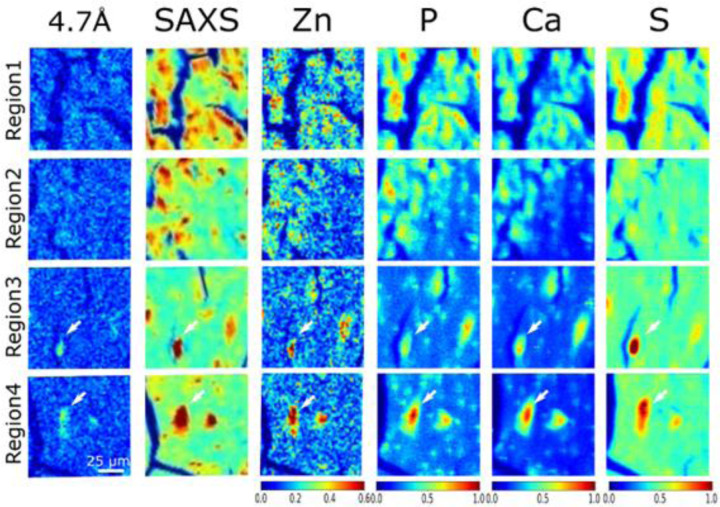
Figure 5.
Correlation of the distribution of tau fibrils (left column), integral intensity of SAXS from macromolecular deposition (second column from left) and distribution of select elements. Regions 1–4 correspond to those highlighted as yellow boxes in Figure 2d and Extended Data Figure S6 and S8. Regions 1 and 2 are in the granular layer, where tau is low in fibrillar content as indicated by µXRD. Regions 3 and 4 are in the hilus where lesions are dominated by fibrillar tau. The white arrows in Regions 3 and 4 highlight the fibrillar tau identified by the 4.7 Å, β-strand reflection. The relative intensity of color scale bars is given in arbitrary units.

