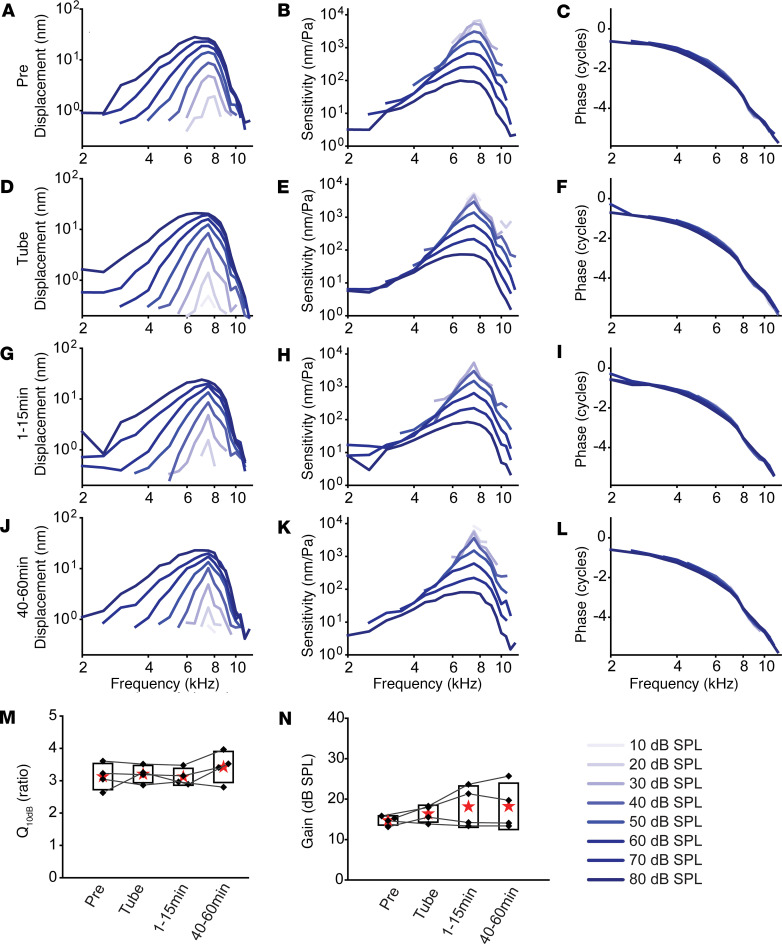
Figure 4. Cochlear mechanics after artificial perilymph injection through the PSCC.
(A–L) Tuning curves, sensitivity curves, and phase measurements recorded at the tectorial membrane using 10- to 80-dB SPL sound stimuli with 2–15 kHz pure tones. Representative curves (A–C) at baseline, (D–F) after canalostomy, (G–I) 1–15 minutes after artificial perilymph injections, and (J–L) 40–60 minutes after artificial perilymph injection. (M) Q10dB measurements calculated using the 40-dB tuning curves (n = 4). P > 0.05 by paired, 2-tailed Student’s t test. (N) Cochlear gain calculated between the 30- and 80-dB SPL tuning curves. No significant differences exist between all conditions (n = 4). P > 0.05 by paired, 2-tailed Student’s t test.

