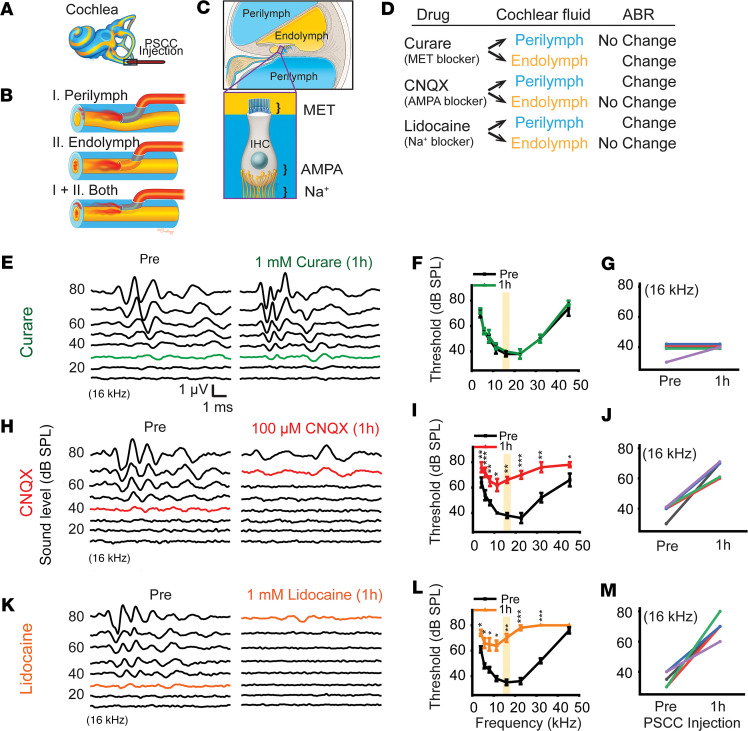
Figure 5. Auditory brainstem response (ABR) after pharmacological manipulations through the PSCC.
(A) Illustration of cochlea with the PSCC injection, where sky blue represents perilymph and yellow represents endolymph. (B) The zoomed-in images of the box in panel A showing possible entry pathways of the PSCC injection, to the perilymph (top), endolymph (middle), or both perilymph and endolymph (bottom). (C) The cross-sectional image of the cochlea shows perilymph and endolymph-filled chambers. The magnified image of the box shows the locations of mechanoelectrical transducer (MET) channel in the inner hair cell (IHC), AMPA receptor at the level of the IHC basolateral membrane, and the Na+ channel in the nerve fibers that synapse with the IHC. (D) The table shows the predicted drug effect on ABR results depending on the compartment (perilymph or endolymph) of entry. (E) Representative ABR responses at 16 kHz in preinjection and 1 hour after curare injection. Green lines indicate thresholds of the ABR responses. (F) ABR thresholds in preinjection and 1 hour after curare injection (n = 5). P > 0.05 by paired, 2-tailed Student’s t test. (G) ABR thresholds of each individual mouse at 16 kHz in preinjection and 1 hour after curare injection (yellow box in panel F). (H) Representative ABR responses at 16 kHz in preinjection and 1 hour after CNQX injection. Red lines indicate thresholds of the ABR responses. (I) ABR thresholds in preinjection and 1 hour after CNQX injection (n = 5). *P < 0.05, **P < 0.01, ***P < 0.001 by paired, 2-tailed Student’s t test. (J) ABR thresholds of each individual mouse at 16 kHz in preinjection and 1 hour after CNQX injection (yellow box in panel I). (K) Representative ABR responses at 16 kHz in preinjection and 1 hour after lidocaine injection. Orange lines indicate thresholds of the ABR responses. (L) ABR thresholds in preinjection and 1 hour after lidocaine injection (n = 5). *P < 0.05, **P < 0.01, ***P < 0.001 by paired, 2-tailed Student’s t test. (M) ABR thresholds of each individual mouse at 16 kHz in preinjection and 1 hour after lidocaine injection (yellow box in panel L).

