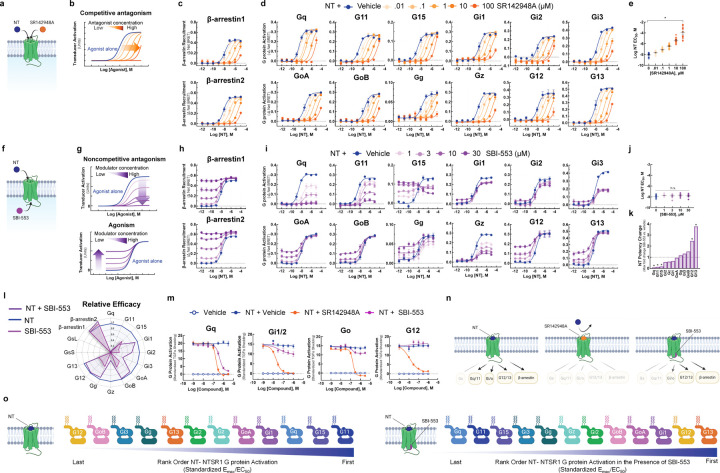
Figure 2. Unlike competitive antagonist SR142948A, SBI-553 biases NT-NTSR1 signaling away from Gq/11 and toward both β-arrestin recruitment and alternative G protein activation.
(A-E) SR142948A uniformly competitively antagonizes NT-induced NTSR1 transducer activation. (A) Illustration of NT and SR142948 competing to occupy the same binding site on NTSR1. (B) Characteristic agonist dose-response curve (DRC) shifts in the presence of increasing concentrations of a competitive antagonist. (C) NT-induced β- arrestin1/2 recruitment to the NTSR1 was assessed by BRET in the absence and presence of SR142948A. (D) NT-induced G protein activation was assessed by TRUPATH in the absence and presence of SR142948A. (E) NT DRC EC50 values for the 12 G proteins evaluated in D in the presence of increasing concentrations of SR142948A. (F-L) SBI-553 exerts transducer-specific effects on NT-induced NTSR1 transducer activation. (F) Illustration of NT and SBI-553 binding distinct sites on the NTSR1. (G) (Top) Characteristic agonist DRC shifts in the presence of a noncompetitive antagonist. (Bottom) Characteristic agonist DRC shifts in the presence of an allosteric agonist. (H) NT-induced human β-arrestin1/2 recruitment to the NTSR1 in the absence and presence of SBI-553. (I) NT-induced G protein activation was assessed by TRUPATH in the absence and presence of SBI-553. (J) NT DRC EC50 values for the 12 G proteins evaluated in H in the presence of increasing concentrations of SBI-553. (K) NT DRC EC50 values for each G protein at the maximal SBI-553 concentration for which a sigmoidal curve could be fit. Data are represented as fold-change from vehicle. (L) Radar plots depict the extent of activation of each transducer in the presence NT or SBI-553 alone and both NT and SBI-553 in combination. Fold-change values are standardized to NT Emax for each transducer. (M) Effect of SR142948A and SBI-553 on NT-induced G protein activation, second assay validation. NT-induced G protein activation was assessed by TGFα shedding. NT-induced activation of Gq, Gi1/2, Go, and G12 sensors in the presence of SR142948A, SBI-553, or vehicle. (N) Illustration of NTSR1 G protein activation following application of NT alone and in the presence of SR149163 or SBI-553. (O) Rank order of NT-NTSR1 G protein preference in the absence and presence of SBI-553. For curve parameters, N, and statistical comparisons, see Table S2.

