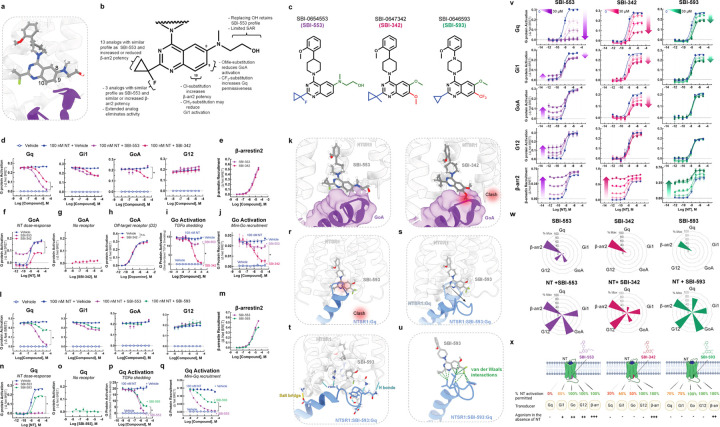
Figure 5. Discovery of SBI-553 analogs with distinct G protein selectivity profiles.
(A) Position of SBI-553 in the NTSR1 intracellular core. Numbers mark quinazoline C8, C9, and C10. GoA shown in purple. (B) Summary of structure-activity relationship (SAR) study findings. (C) Structures of SBI-553 and analogs SBI-342 and SBI-593. (D-K) Analog SBI-342 exhibits Go antagonism, not agonism. (D) Screen evaluating SBI-342 antagonism of NT-induced Gq, Gi1, GoA, and G12 activation by TRUPATH. (E) Screen evaluating SBI-342 β-arrestin2 agonism by BRET. (F) Effect of 30 μM SBI-553 vs SBI-342 across the NT GoA DRC. (G) Assessment of SBI-342 on GoA TRUPATH activation sensor activity in HEK293T cells not expressing NTSR1. (H) Assessment of SBI-342 (30 μM) on GoA activation stimulated by the Gi/o-coupled dopamine receptor D2. (I) Comparison of SBI-553 and SBI-342 antagonism of NT-induced Go activation in the AP-TGFα shedding assay. (J) Comparison of SBI-553 and SBI-342 antagonism of NT-induced miniGoA recruitment to the NTSR1 by BRET. (K) SBI-553 can co-occupy NTSR1 with GoA’s C-terminus in its ‘open’ position, while the 9-methoxy of SBI-342 clashes with GoA. (L-U) Analog SBI-593 exhibits partial rather than full Gq antagonism. (L) Screen evaluating SBI-593 antagonism of NT-induced Gq, Gi1, GoA, and G12 activation by TRUPATH. (M) Screen evaluating SBI-593 β-arrestin2 agonism by BRET. (N) Effect of 30 μM SBI-553 vs SBI-593 across the NT Gq DRC. (O) Assessment of SBI-593 on Gq TRUPATH activation sensor activity in HEK293T cells not expressing NTSR1. (P) Comparison of SBI-553 and SBI-593 antagonism of NT-induced Gq activation in the AP-TGFα shedding assay. (Q) Comparison of SBI-553 and SBI-593 antagonism of NT-induced miniGoA recruitment to the NTSR1 by BRET. (R) Docking SBI-593 into the SBI-553 binding site in the NTSR1:Gq structure (PDB 8FMZ) indicates a clash between Gq and SBI-593, as for SBI-553. (S) Molecular dynamics simulations indicate a repositioning of the Gq C-terminus within the NTSR1 core. (T) Interactions between NTSR1 and Gq stabilizing this new position are shown. (U) Attractive van der Waals contacts between SBI-593 and the Gq C-terminus its new position are illustrated as dotted green lines. (V-X) SBI-553 analogs have distinct G protein selectivity profiles. (V) NT-induced G protein activation was assessed in the absence and presence of SBI-553, −342, and −593. (W) Radar plots depict extent of transducer activation induced by SBI-553, −342, and −593 alone (top) and in the presence of NT (bottom). Values reflect maximal % Emax relative to NT (G proteins) or SBI-553 (β-arrestin2). (X) Summary of NTSR1 G protein activation following application of NT in the presence of SBI-553, −342, and −593. For curve parameters, N, and statistical comparisons, see Table S5. For supporting data, see Figures S3–9.

