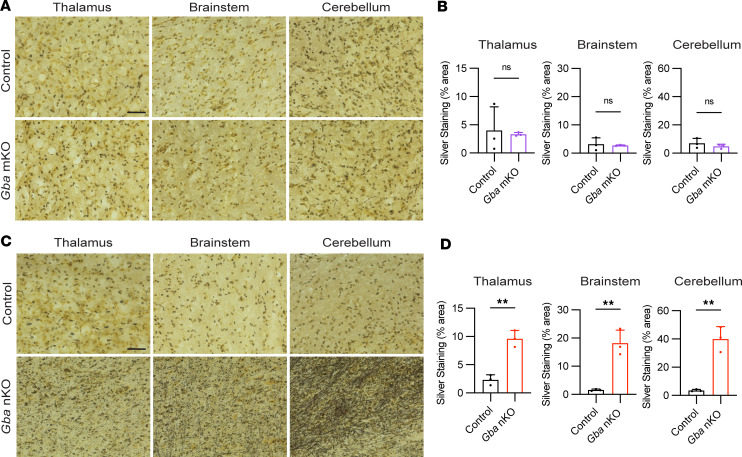
Figure 6. Gba-nKO mice exhibit neurodegeneration quantified by silver staining.
(A) Representative images of thalamus, brain stem, and cerebellum from silver-stained control and Gba-mKO mouse brains. (B) Quantification of silver staining in Gba-mKO brains compared with controls. (C) Representative images of thalamus, brain stem, and cerebellum from silver-stained control and Gba-nKO mouse brains. (D) Quantification of silver staining in Gba-nKO brains compared with controls. Gba-mKO and -nKO brains were collected at 12 months and 16–18 weeks, respectively. Unpaired t test. n = 3. Scale bars: 50 μm. **P < 0.01.

