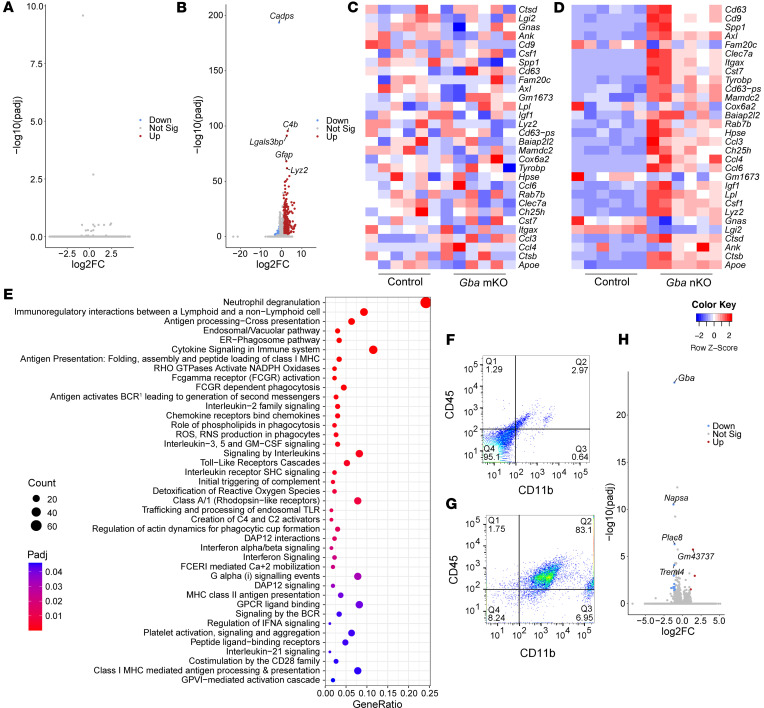
Figure 9. Bulk RNA-Seq of brain tissue reveals substantial changes in gene expression in Gba-nKO mice but not in Gba-mKO mice.
(A and B) Volcano plots displaying differentially expressed genes (DEGs) in Gba-mKO (A) and Gba-nKO (B) mouse brains at 12 months and 15–16 weeks of age, respectively. The 5 most significant DEGs are labeled. n = 6. (C and D) Heatmap of genes related to disease-associated microglia (DAM) in Gba-mKO mice (C) and Gba-nKO mice (D) relative to controls. Gene order is computed based on row means. (E) Graph of all significantly enriched reactome terms in Gba-nKO mice. (F and G) Cells stained for CD45 and CD11b before (F) and after (G) microglial isolation. (H) Volcano plot displaying DEGs in Gba-mKO microglia, isolated from whole brain at 13–15 months of age. The top 5 DEGs are labeled. n = 4. |Log2FC| > 1. Padj < 0.05.

