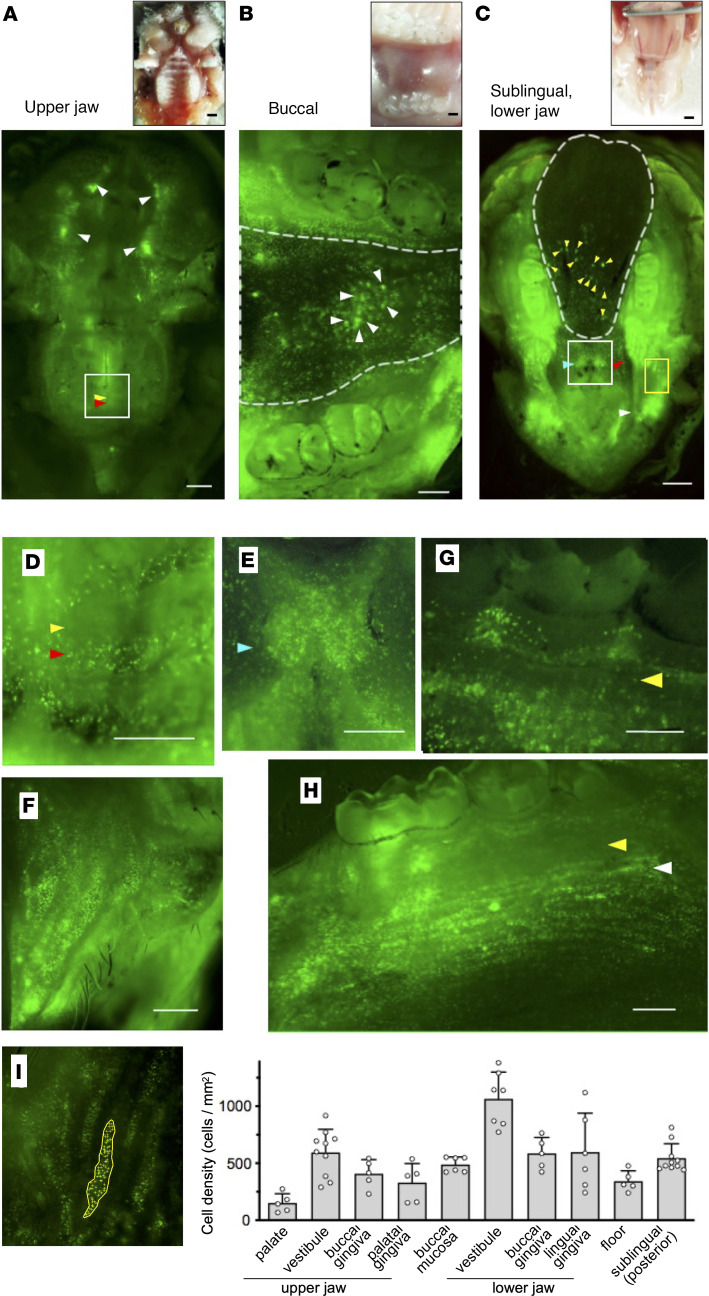
Figure 1. Distinct distribution patterns of DCs in the oral cavity of CD11c-YFP mice.
(A–C) Bright-field images (upper panels) and fluorescence images (lower panels) acquired using fluorescence stereoscopic microscopy. (A) Upper jaw. White, yellow, and red arrowheads in lower panel point to the oral vestibules, palate folds, and the intermediate region, respectively. (B) Buccal mucosa. The region enclosed by the dotted line indicates the buccal mucosa and arrowheads point to high-density DC spots (lower panel). (C) Sublingual mucosa and oral floor. The region enclosed by the dotted line indicates the sublingual mucosal surface and white, red, and light blue arrowheads point to the vestibules, the alveolar ridge in front of the molars, and the caruncle, respectively (lower panel). Yellow arrowheads point to high-density DC spots in the sublingual region. (D–H) Fluorescence images acquired using fluorescence stereoscopic microscopy. (D) Magnified image of the area enclosed in the white box in A. Yellow and red arrowheads point to the palate folds and the intermediate region, respectively. (E) Magnified image of the area enclosed in the white box in C. Light blue arrowhead points to the caruncle. (F) Magnified image of the area enclosed in the yellow box in C. (G) Buccal gingiva. Yellow arrowhead points to the attached gingiva. (H) Lingual gingiva. Yellow and white arrowheads point to the attached gingiva and mucogingival junction, respectively. (I) The number of DCs in each region of the oral cavity in which the DCs accumulated (left) was assessed and calculated as the DC density of each region of the oral cavity (right). Data represent mean ± SEM (n = 5). The data are representative of at least 3 independent experiments. CD11c-YFP is stained green. Scale bars: 1000 μm (A and C) and 500 μm (B and D–H).

