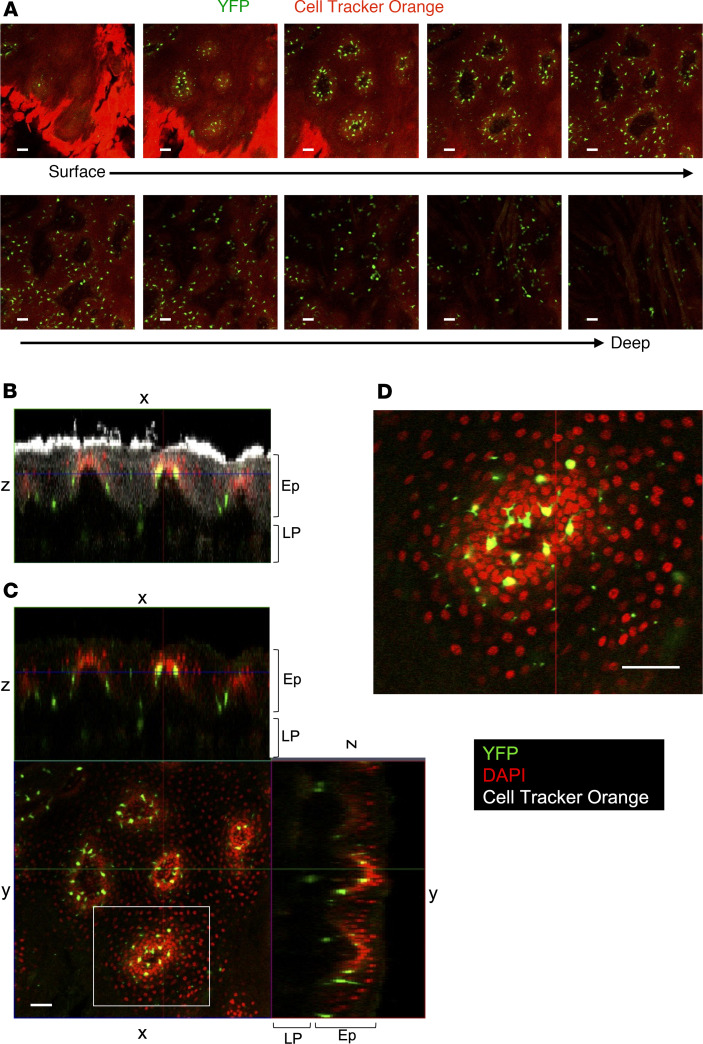
Figure 3. Single DCs scattered in the basal layer of rete pegs in the buccal mucosa.
The CD11c+ cells in the buccal mucosa were observed using confocal microscopy. (A) Z-stack images from the mucosal surface to muscle layer. Green, CD11c-YFP. Red, Cell Tracker Orange. (B and C) Orthogonal view of the buccal mucosa: x–z image (B) and x–z, x–y, and y–z images (C). (D) High magnification of the image enclosed by the white square in C. Green, YFP. Red, DAPI. White, Cell Tracker Orange. The data are representative of at least 3 independent experiments. Scale bars: 50 μm. LP, lamina propria; Ep, epithelium.

