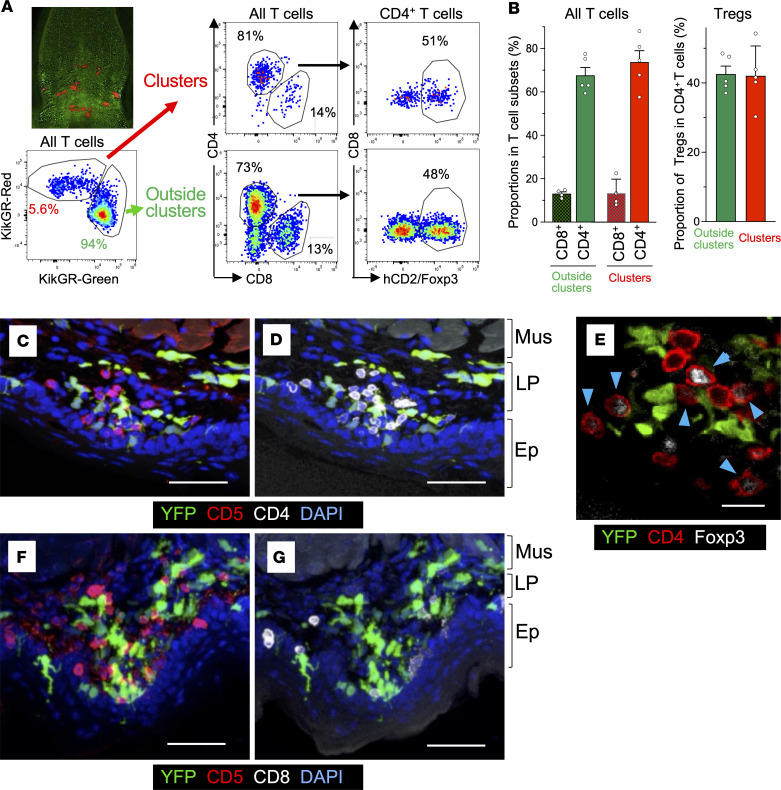
Figure 7. Foxp3+ and Foxp3– CD4+ T cells and CD8+ T cells in sublingual DC clusters.
(A) Sublingual KikGR+ DC clusters in hCD2/CD52-Foxp3/KikGR mouse bone marrow chimeric mice were photolabeled similarly to those in Figure 5A and single-cell suspensions were stained with fluorochrome-conjugated antibodies. Representative flow cytometry plots of photolabeled KikGR-Red T cells in clusters and non-photolabeled T cells outside clusters. (B) Proportions of CD4+ T cells and CD8+ T cells in all T cells (left) and Foxp3+ cells in CD4+ T cells (right). Data represent mean ± SEM (n = 5). (C, D, F, and G) Images of a frozen section of sublingual tissue of CD11c-YFP mice, stained with anti-CD5 mAb (red), anti-CD4 mAb (white), and DAPI (blue) (C and D) (Supplemental Video 7), or stained with anti-CD5 mAb (red), anti-CD8 mAb (white), and DAPI (blue) (F and G) (Supplemental Video 8). (E) Images of a frozen section of sublingual tissue in CD11c-YFP mice stained with anti-CD4 mAb (red) and anti-Foxp3 mAb (white). The data are representative of at least 3 independent experiments. Scale bars: 50 μm (C, D, F, and G) and 20 μm (E). Mus, muscle layer; LP, lamina propria; Ep, epithelium.

